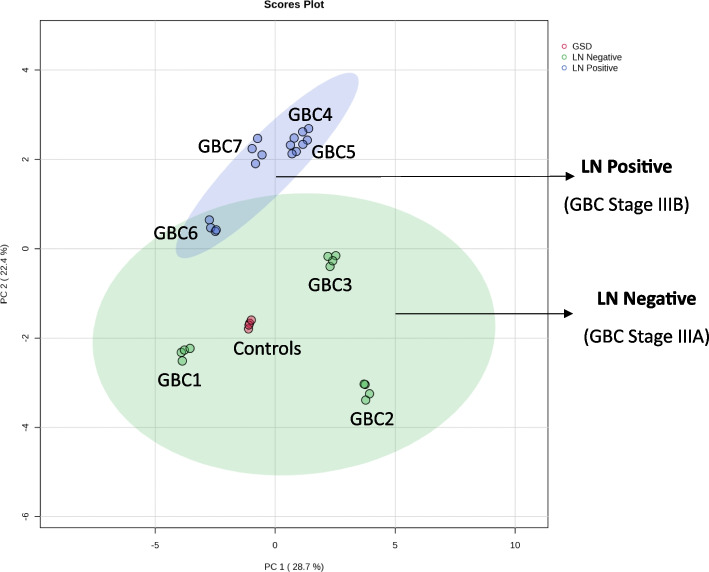
Fig. 2.
Principal component analysis for the control, LN negative and LN positive cases. We observed a significant correlation among the four technical replicates for each sample and found the majority of the LN negative cases group together. PCA was performed based on the log2-transformed intensity of proteins identified in the four replicates. Green area is depicting the LN negative and blue area indicates LN positive GBC. Red dots indicate controls. The PCA plot is derived using the iTRAQ reporter intensity from the quantitative proteomics data using metaboanalyst

