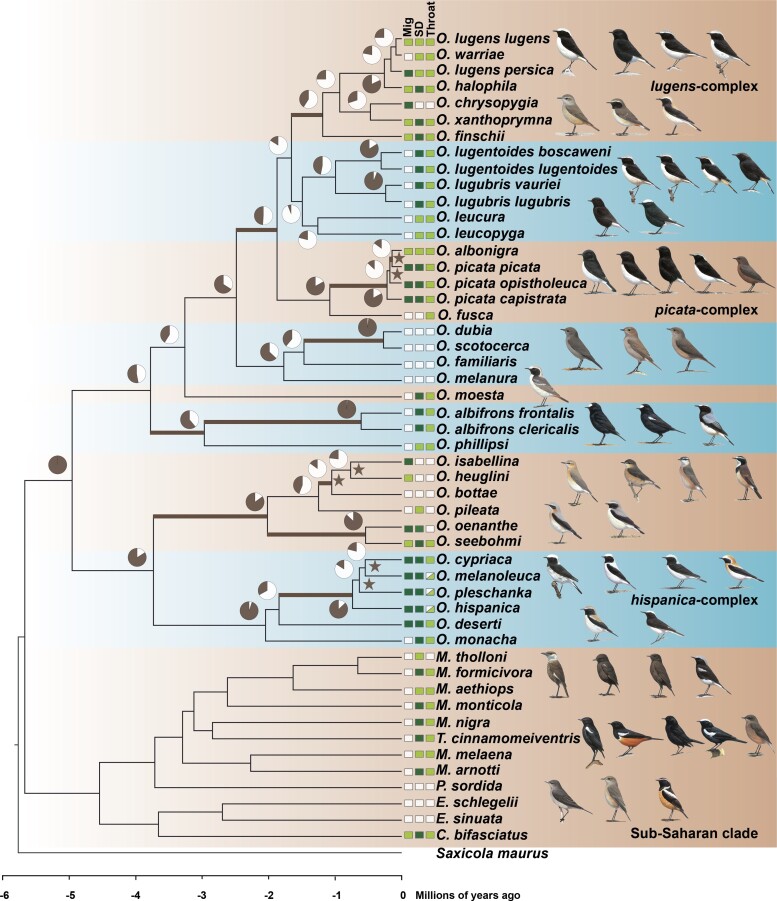
Fig. 1.
Time-calibrated phylogenetic tree of open-habitat chats and levels of ILS. All nodes are supported by bootstrap values of 100. Pie charts depict the gene tree heterogeneity for each internal branch, with the dark proportion indicating the proportion of concordant gene trees (gCF). Bold branches indicate internal branches for which ILS alone is statistically sufficient to explain the observed gene tree heterogeneity. Stars indicate branches that are in the phylogenetic anomaly zone. The character states of three selected characters: Sexual dimorphism (SD), monomorphic female-type (white), monomorphic male-type (pale green), dimorphic (dark green); Migratory behavior (Mig), sedentary (white), short-distance migrant (pale green), long-distance migrant (dark green); and throat coloration (throat), white (white), black (pale green), and polymorphic (white and pale green). Drawing courtesy of Chris Rose (www.chrisrose-artist.co.uk) with permission from Bloomsbury Publishing Plc.

