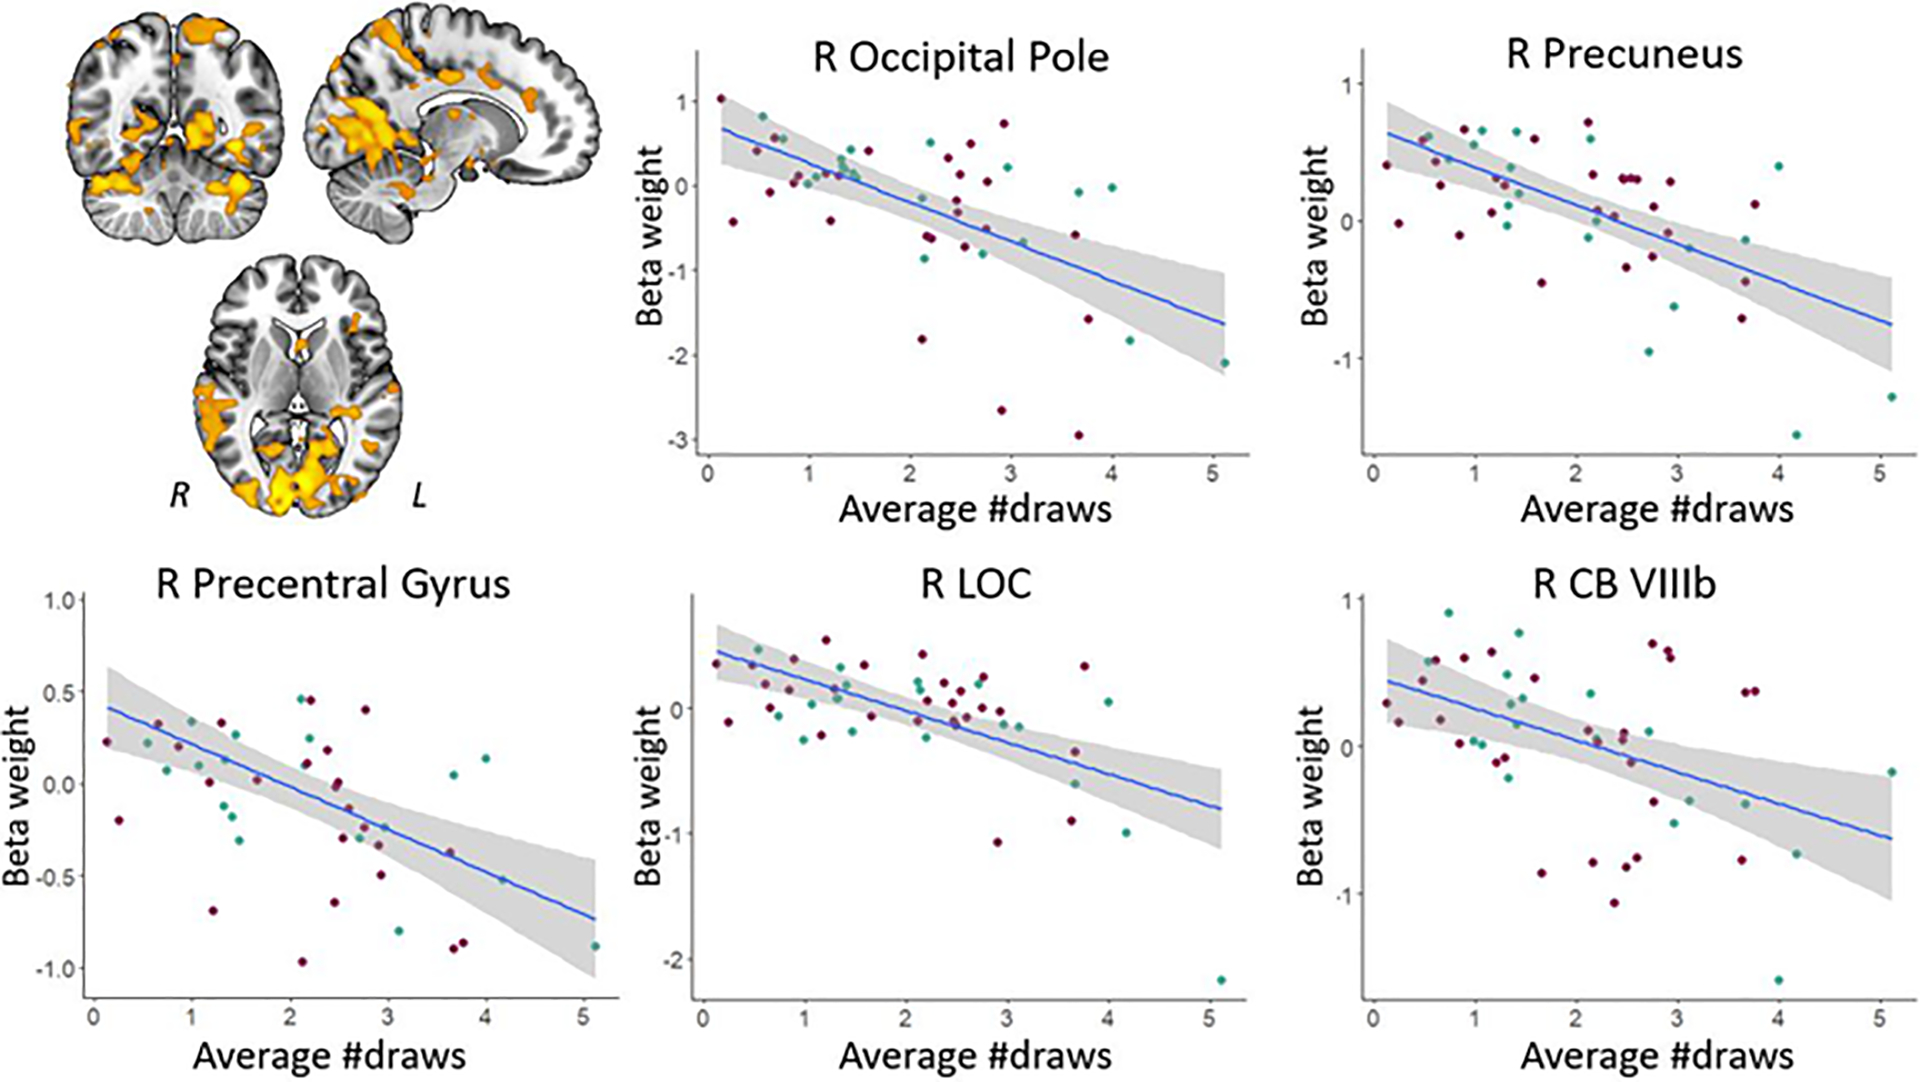
Figure 4.

Regions showing negative associations (at the TFCE level) between win-specific activation and the number of draws. Scatter plots illustrate the association between impulsiveness and activation for selected areas; note that smaller draw values reflect more impulsivity. The right side of each image corresponds to the patients’ left side. The key for the abbreviations can be found in the notes of Table 4.
