
Figure 4. Demonstration of leading hydrogel coating on PDMS surfaces.
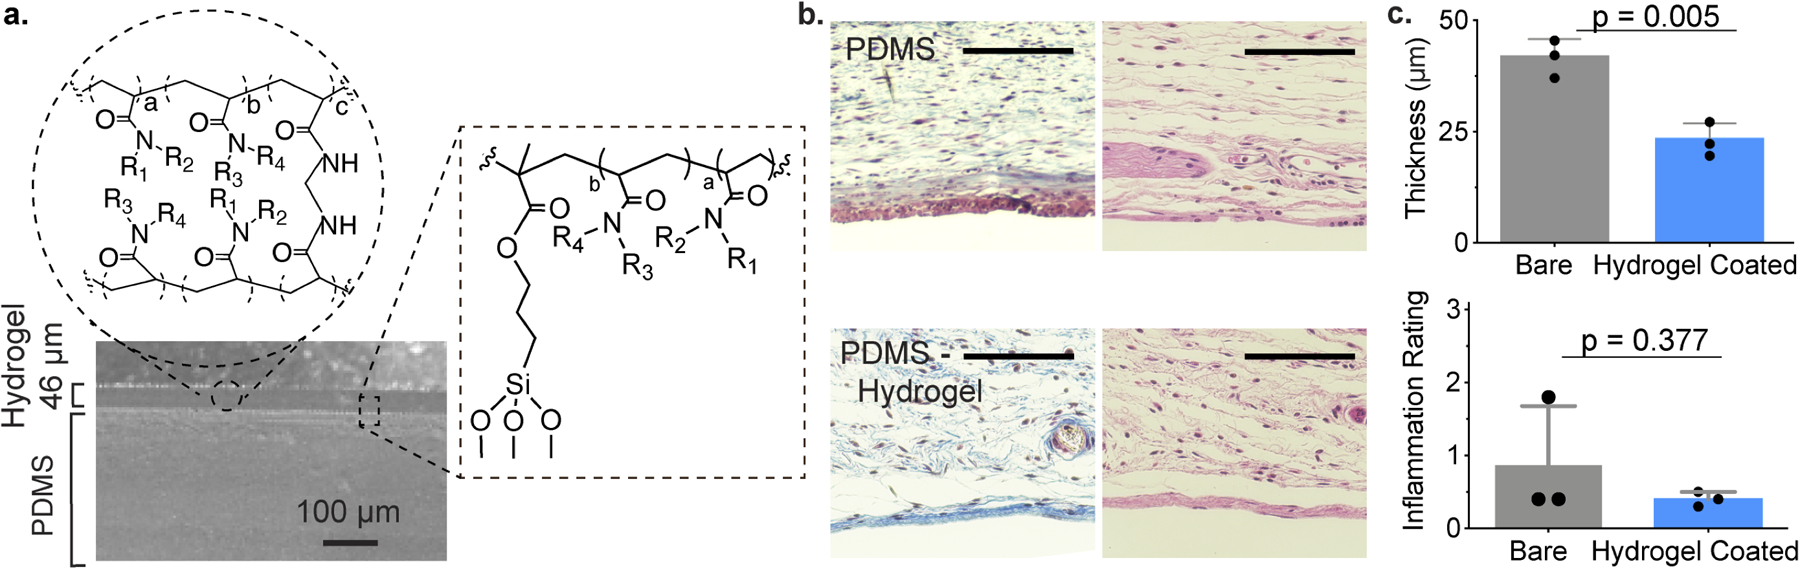
a. Homogenous coating of D5 copolymer hydrogels to PDMS visualized by SEM. b. Representative images of MT (left) and H&E (right) staining of explanted hydrogels and adjacent tissues. Scale bar represents 100 μm. c. Quantitative measurements of fibrosis (top), and semi-quantitative inflammation scores as assigned by pathologists blinded to the test materials. Mean ± s.d. Significance from unpaired t test.