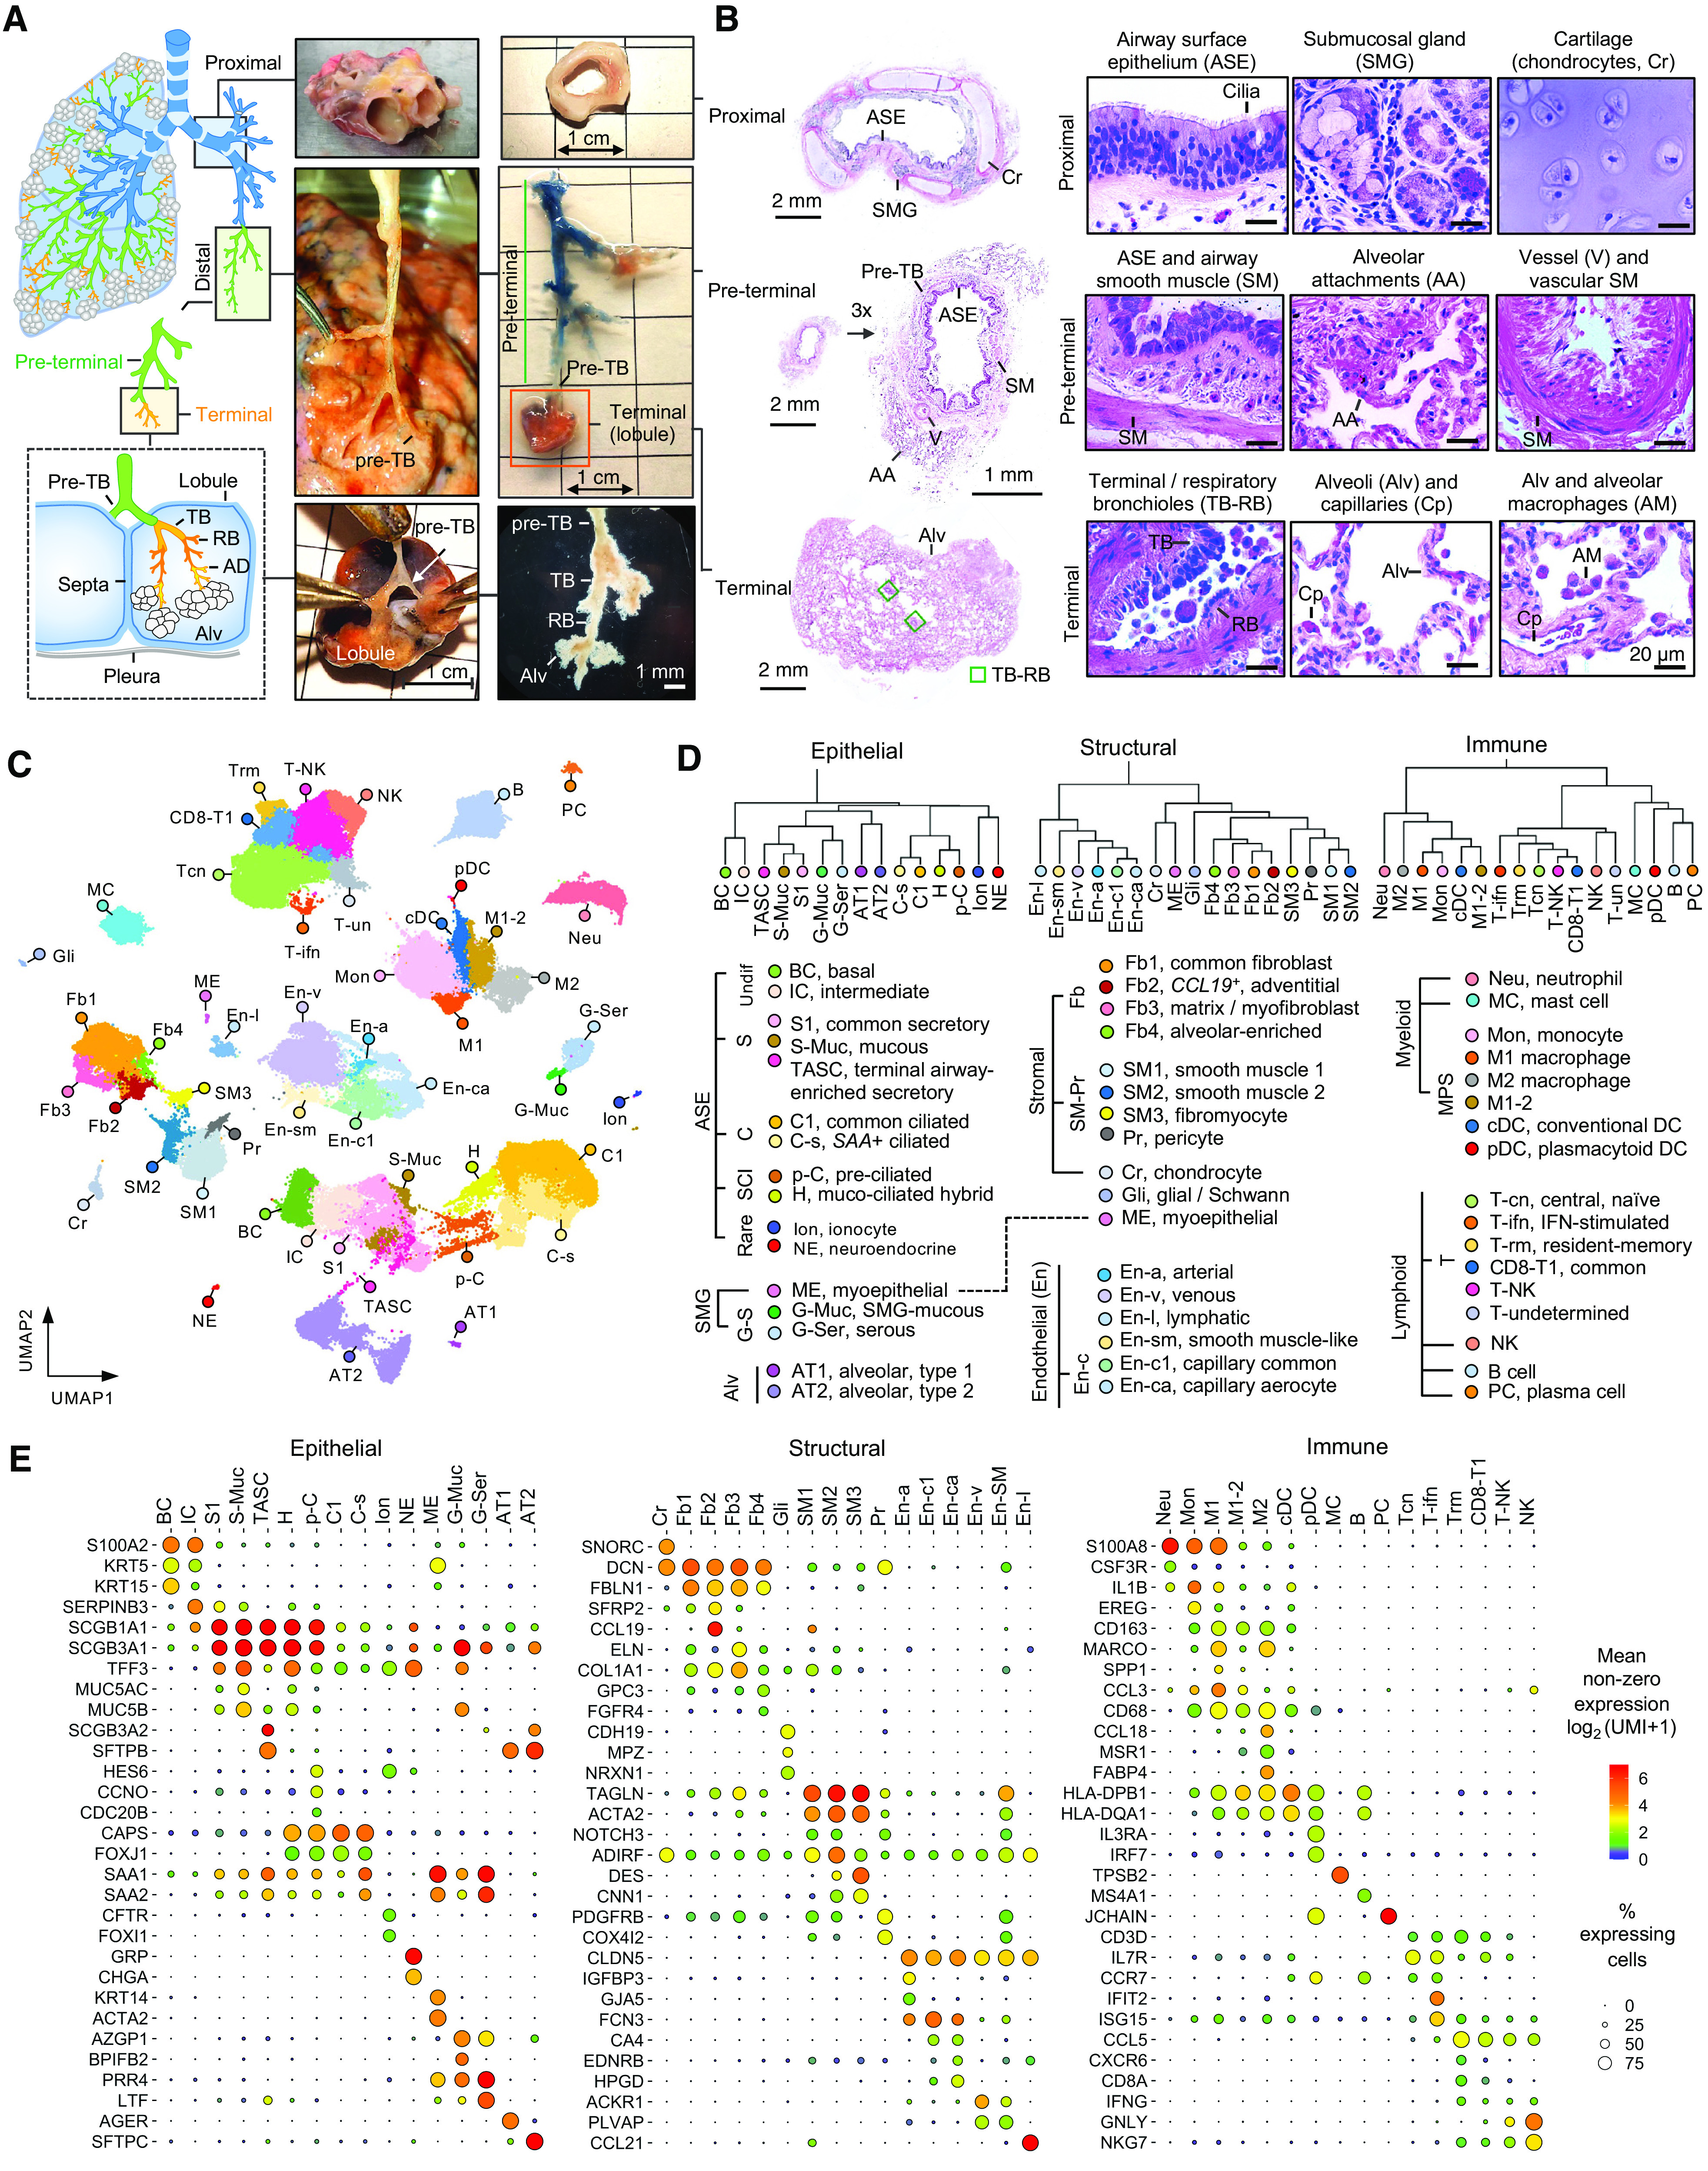
Figure 1.

The atlas of cellular diversity along the proximal (P)–distal (D) airway axis of human lung. (A) Anatomy and examples of dissected P and D airway regions of the human lung. D region included preterminal (pre-T) and terminal (T) regions separated by preterminal bronchioles (pre-TBs). Pre-T region included pre-TBs and three or four generations proximal to pre-TBs. T region included segments within the lobule supplied by pre-TBs: TBs, respiratory bronchioles (RBs), alveolar ducts (ADs), and alveoli (Alv). Lower left image shows T region inspected under dissection microscope. (B) Examples of hematoxylin and eosin staining of dissected P, pre-T, and T regions. Histological landmarks are shown. (C) Uniform Manifold Approximation and Projection (UMAP) clustering of 111,744 single cells isolated from P (n = 5), pre-T (n = 13), and T (n = 7) regions of healthy lungs and pre-T airways of subjects with COPD (n = 5). (D) Dendrograms based on hierarchical clustering of cell groups identified in C based on top 2,000 variable genes using Spearman correlation and complete linkage algorithm. Specific cell groups within epithelial, structural, and immune superfamilies are shown. (E) Dot plots showing expression of selected marker genes in indicated cell groups. Dot size reflects percentage of cells within a group expressing a given gene. Dot color shows mean expression level as indicated.
