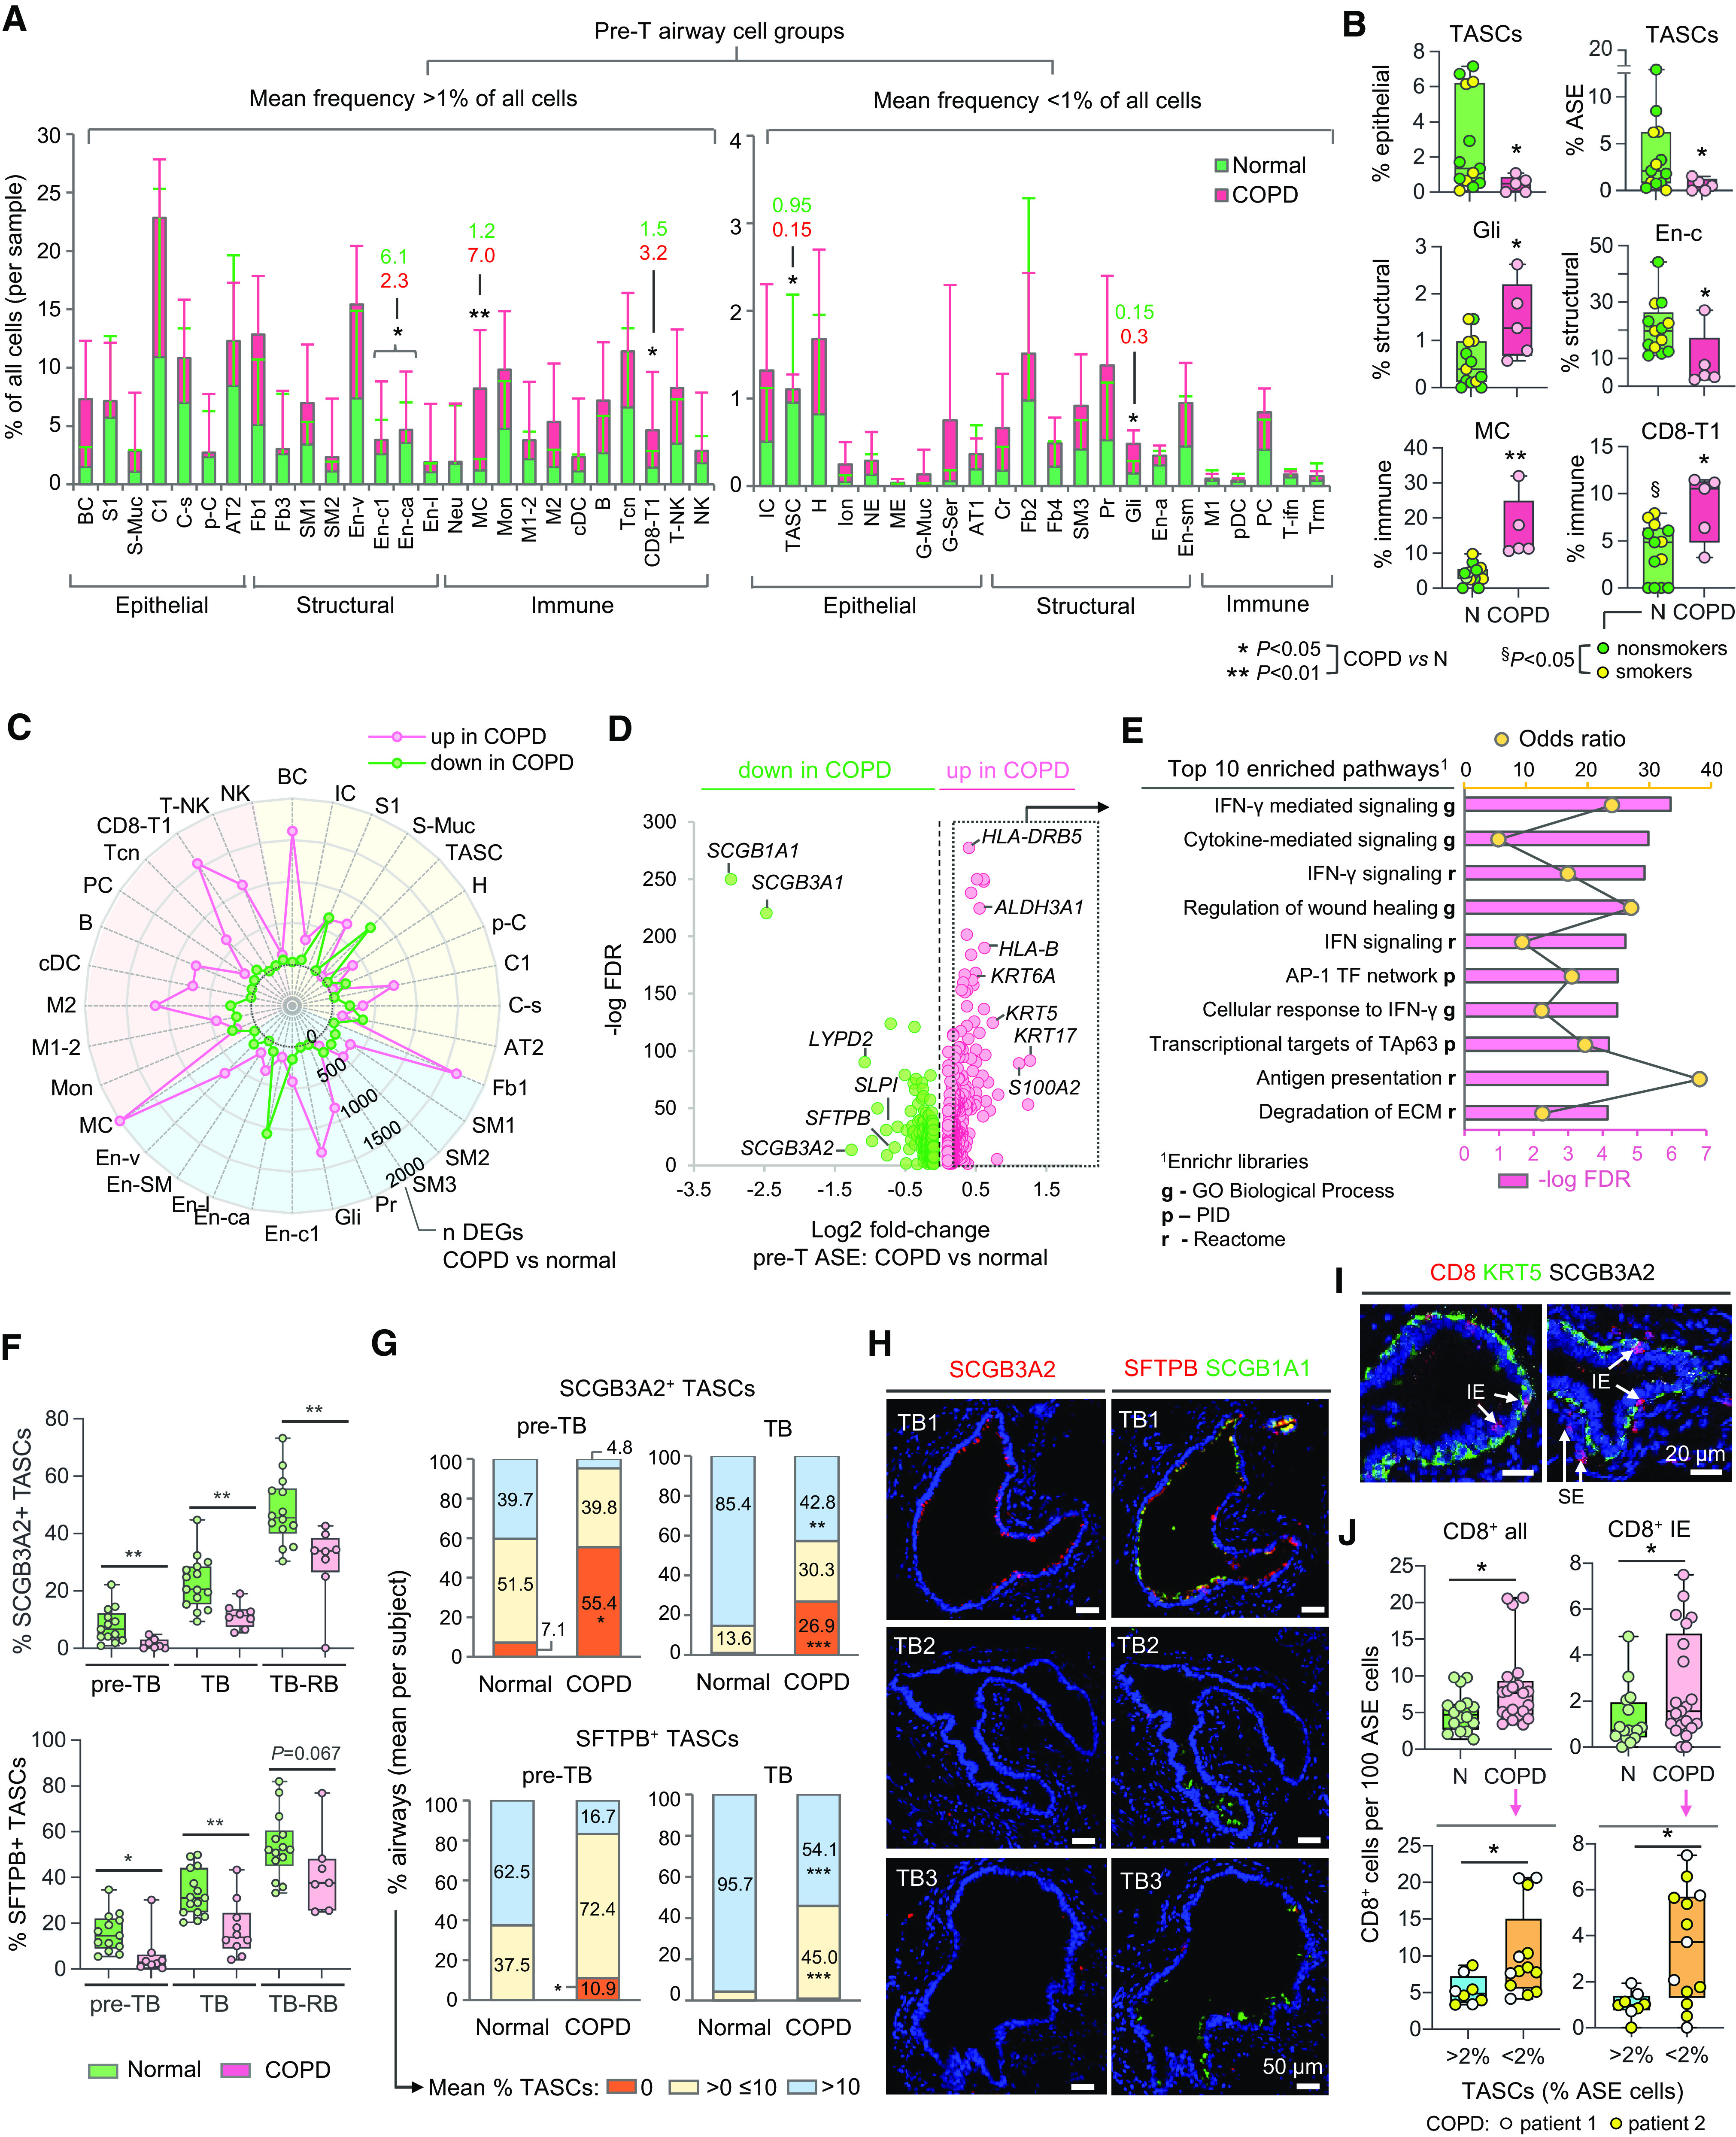
Figure 3.

Changes in cellular organization of chronic obstructive pulmonary disease (COPD) distal airways. (A, B) Proportions (percentages) of indicated cell groups (single-cell RNA-sequencing [scRNA-seq] data; abbreviations described in Figure 1D) in pre-terminal (pre-T) airway samples of donors without lung disease (normal; n = 13) and subjects with COPD (n = 5): (A) Mean percentage of cells in indicated cell groups among all cells per sample (values are shown for cell groups with significant differences between the groups). Error bars represent standard deviation. (B) Mean percentage of cells in indicated cell groups among all cells per sample within superfamilies (dots: individual samples). (C) Radar plot showing numbers of differentially expressed genes (DEGs) identified by comparing scRNA-seq average gene expression profiles of indicated cell groups in pre-T samples (COPD vs. normal) described in A. Criteria for cell types/subtype inclusion: >10 cells in each group (normal; COPD); at least 3 cells in >50% samples in each group. Colored areas: epithelial (yellow), structural (blue), and immune (red) superfamilies. Dots show numbers of DEGs up- or downregulated in COPD versus normal samples (Mann-Whitney P < 0.05). (D) Volcano plot showing DEGs (false discovery rate <0.05) identified by comparison of scRNA-seq average expression profiles of airway surface epithelial (ASE) cells in COPD versus normal pre-T samples described in A. (E) Top 10 annotation categories among Gene Ontology (GO) Biological Process; Reactome and NCI-Nature Pathway Interaction database (PID) libraries enriched among DEGs upregulated in ASE of COPD versus normal pre-T samples (log2 fold change >0.2); ranked by −log false discovery rate of enrichment; based on Enrichr analysis. (F–H) Immunofluorescence analysis. (F) Mean percentage of SCGB3A2+ (upper) and SFTPB+ (lower) terminal airway-enriched secretory cells (TASCs) per subject among ASE cells in preterminal bronchiole (pre-TB), TB, and TB-RB (defined as in Figures 2G–2I) of healthy lung donors and subjects with COPD. Dots represent individual subjects (see Table E2 for details). (G) Distribution of distal airways (pre-TBs and TBs) in healthy and COPD lung tissue samples (described in F) based on average percentage of SCGB3A2+ (upper) and SFTPB+ (lower) cells in the ASE (per subject). (H) Representative immunofluorescence images showing SCGB3A2+ TASCs, SFTPB+ TASCs, and SCGB1A1 expression in different TBs of the same COPD patient’s lung. (I, J) Imaging CyTOF. (I) Representative images showing CD8+ cells (intraepithelial [IE]; subepithelial [SE]) in distal airways (pre-TBs/TBs) of patients with COPD; KRT5, keratin 5; SCGB3A2 (white). (J) Frequency of all (left) and IE (right) CD8+ cells in distal airways of normal (N; n = 3; 16 airways) and COPD (n = 2; 21 airways) subjects (upper panel); shown separately in the lower panel for COPD distal airways with TASC frequency: >2% and <2% of epithelial cells. *P < 0.05, **P < 0.01, ***P < 0.005 (two-tailed Mann-Whitney test) COPD versus normal (A, B, F, G, and J, upper), and §P < 0.05 normal lung donors: smokers versus nonsmokers (two-tailed Mann-Whitney test) in B; COPD distal airways with TASC frequency >2% versus <2% of epithelial cells (J, lower). CyTOF = cytometry by time of flight; RB = respiratory bronchioles.
