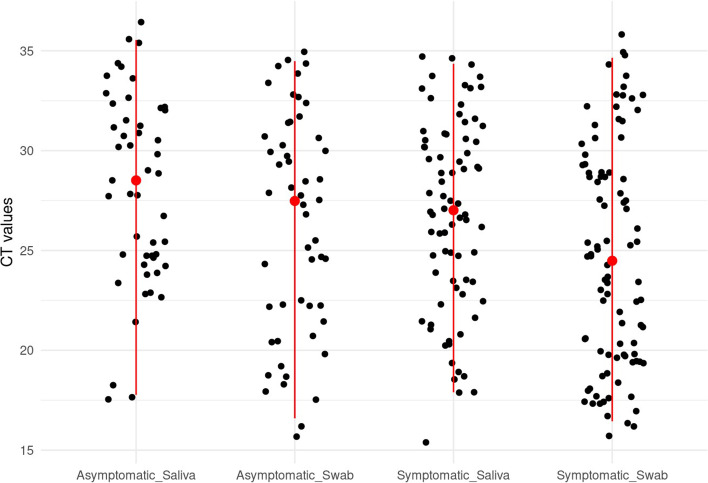
Fig. 2.
Comparison of Cycle threshold values of SARS-CoV-2 RT-PCR obtained from unstimulated whole saliva and combined nasopharyngeal/oropharyngeal swabs specimens for asymptomatic and symptomatic patients. Note. Cycle threshold (Ct) values are distributed by testing concordance between asymptomatic and symptomatic patients. Each “dot” represents a positive SARS-CoV-2 RT-PCR result. Red dots represent the median Ct values for unstimulated whole saliva and combined nasopharyngeal/oropharyngeal swabs. Data only include results of positive RT-PCR for SARS-CoV-2.

