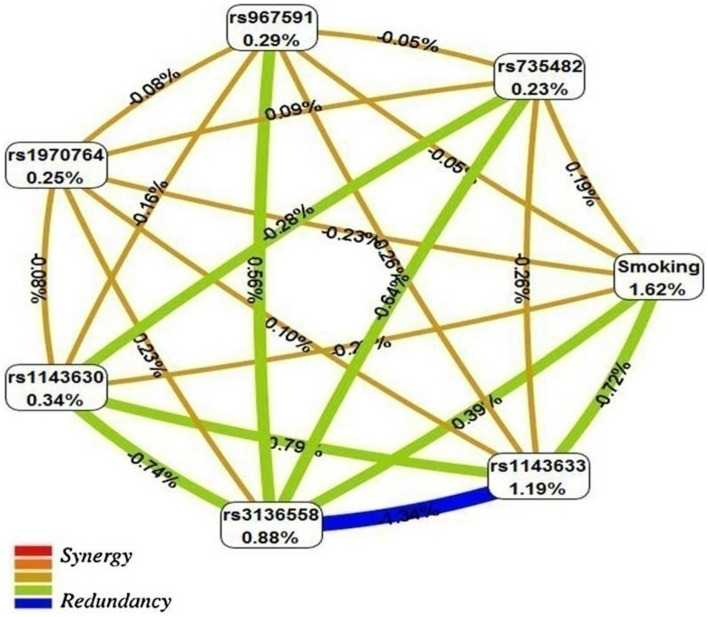
Figure 1.
Interaction entropy model. This graphical model, describes the percent entropy that is explained by each selected attributes or pair-wise combination in our study population. Positive percent entropy indicates information gain (IG) or synergy and negative percent indicates lack of information gain (IG) or redundancy. Schematic coloration used in the visualization tools represents a continuum from synergy (i.e. non-additive) to redundancy. Red represents a high degree of synergy interaction, orange a lesser degree (both colors are not apparent in the current analysis), brown represents medium-level interaction or independence; and green and blue represent redundancy between the markers. This image was created by MDR software (3.0.3. dev. Jar) (https://sourceforge.net/projects/mdr/)36.

