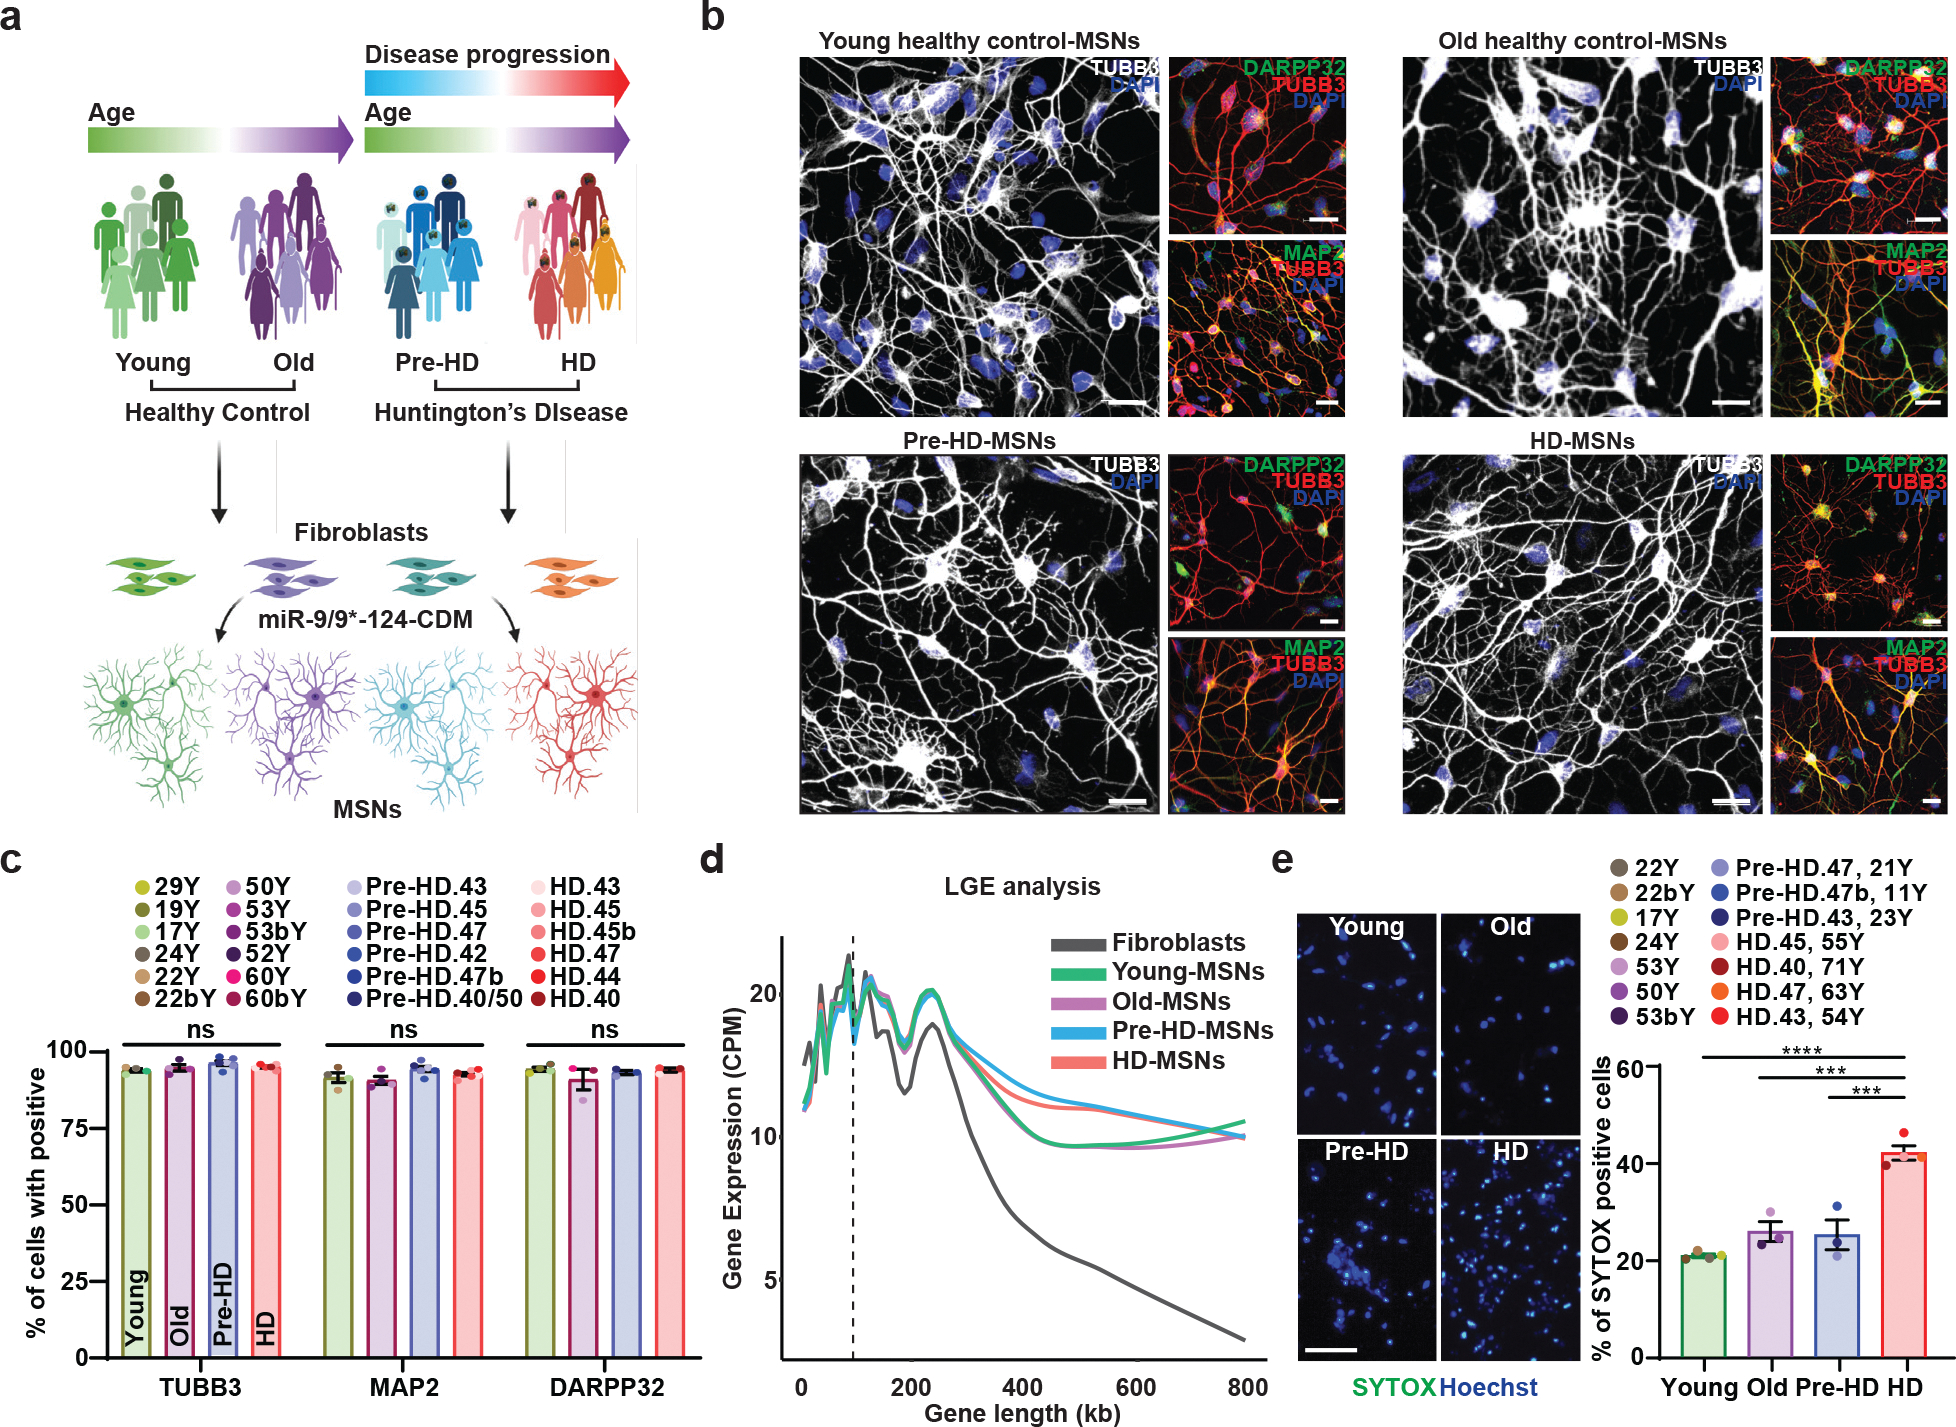
Fig. 1. Differential manifestation of neurodegeneration between MSNs derived from healthy control individuals and HD patients.

a, Experimental scheme for MSN derivation from fibroblasts of pre-symptomatic (Pre-HD-MSNs), symptomatic HD patients (HD-MSNs), and their respective healthy control individuals of similar ages (Young/Old-MSNs). b, Representative images of TUBB3-, DARPP32-, and MAP2-positive cells from Young/Old healthy control MSNs, Pre-HD-MSNs, and HD-MSNs. c, Quantification of TUBB3-, MAP2- and DARPP-32-positive cells in (b); averages of 300–600 cells per group from independent HD and healthy control lines (n=13 or 20 individual’s reprogrammed MSNs). d, The average long gene expression (LGE), a transcriptomic feature of neuronal identity, in fibroblasts, young/old-MSNs, Pre-HD-, and HD-MSNs. X-axis corresponds to gene lengths (kb) defined by the start and stop genomic coordinates and Y-axis corresponds to gene expression (CPM). The dotted line depicts 100kb in gene length. e, Representative images (left) and quantification (right) of SYTOX-positive cells as a fraction of Hoechst-positive cells (n=14 individual’s reprogrammed MSNs, Young vs. HD p<0.0001, Old vs. HD p=0.0004, Pre-HD vs. HD p=0.0003). For all figures shown, statistical significance was determined by one-way ANOVA (c,e). ****p<0.0001, ***p<0.001, ns, not significant. Scale bars in b 20μm, in e 100μm. Mean±s.e.m.
