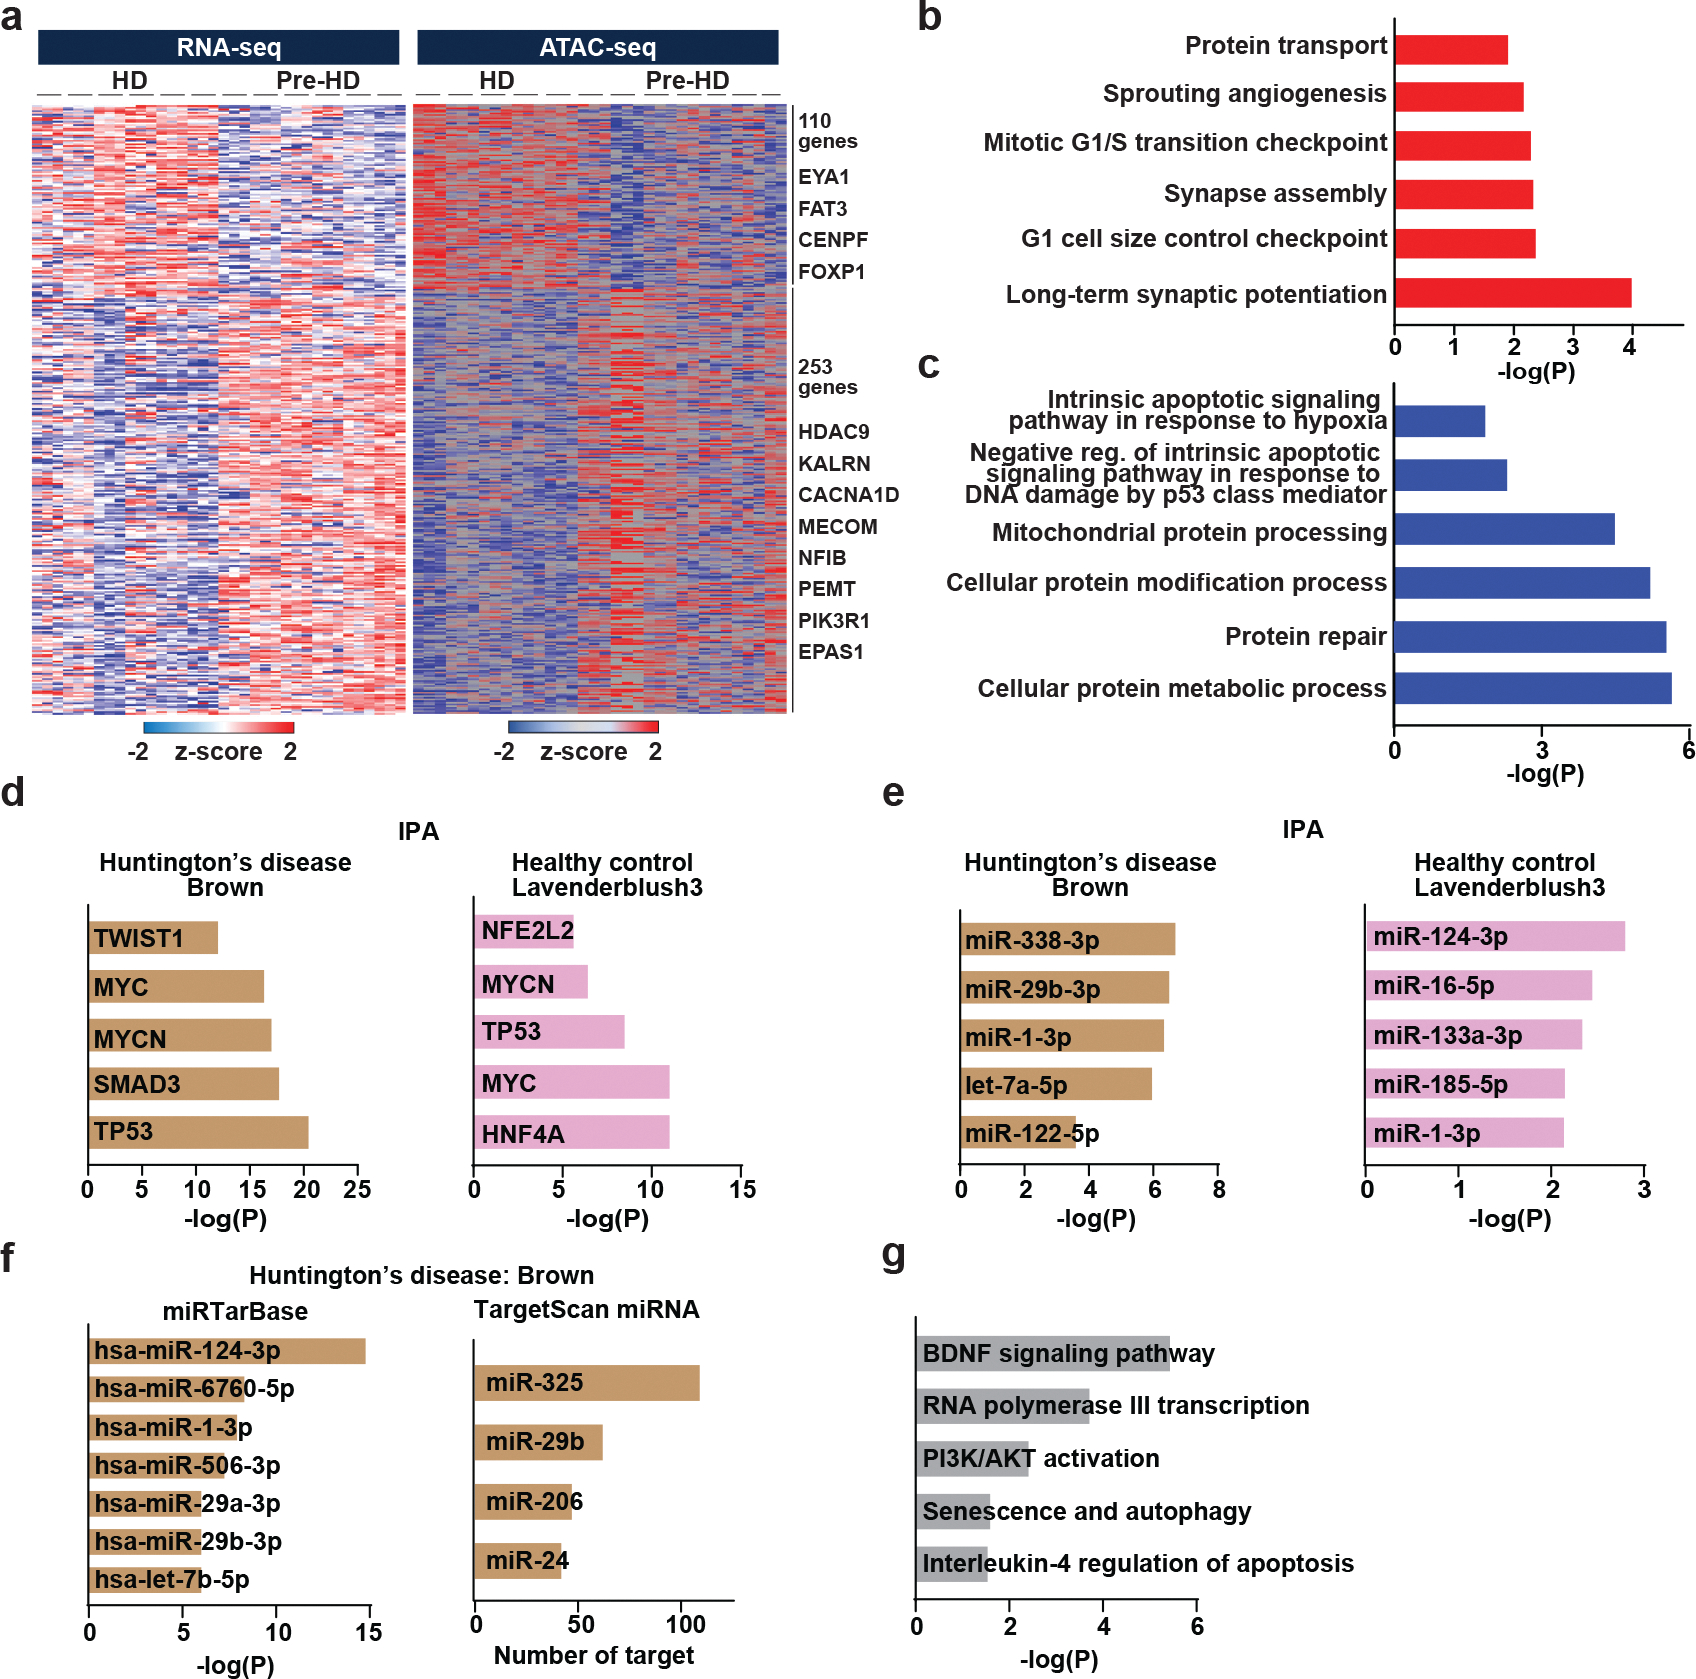
Extended Data Fig. 4. Pre-HD-MSNs and HD-MSNs display differential chromatin accessibilities.

a, A heatmaps showing gene expression levels for DEGs that positively correlated with signal intensities of ATAC-seq in their promoter regions. Signal intensity is based on normalized CPM values. Data are shown as Z-score normalized log2CPM (adjusted p<0.05, │log2FC│>1). b, c, GO terms associated with opened and upregulated genes (b) and closed and downregulated genes (c). d, Transcription regulators predicted as upstream regulators of the brown module (Huntington’s disease) and the lavenderblush3 (healthy control) by Ingenuity Pathway Analysis (IPA). e, Mature microRNAs predicted as an upstream regulator of the brown module (Huntington’s disease) and the lavenderblush3 (healthy control) by Ingenuity Pathway Analysis (IPA). f, MicroRNAs predicted as an upstream regulator of the brown module (Huntington’s disease) by miRTarBase and TargetScan. g, Pathways enriched in target genes of miR-29b-3p in the brown module (Huntington’s disease) by BioPlanet analysis.
