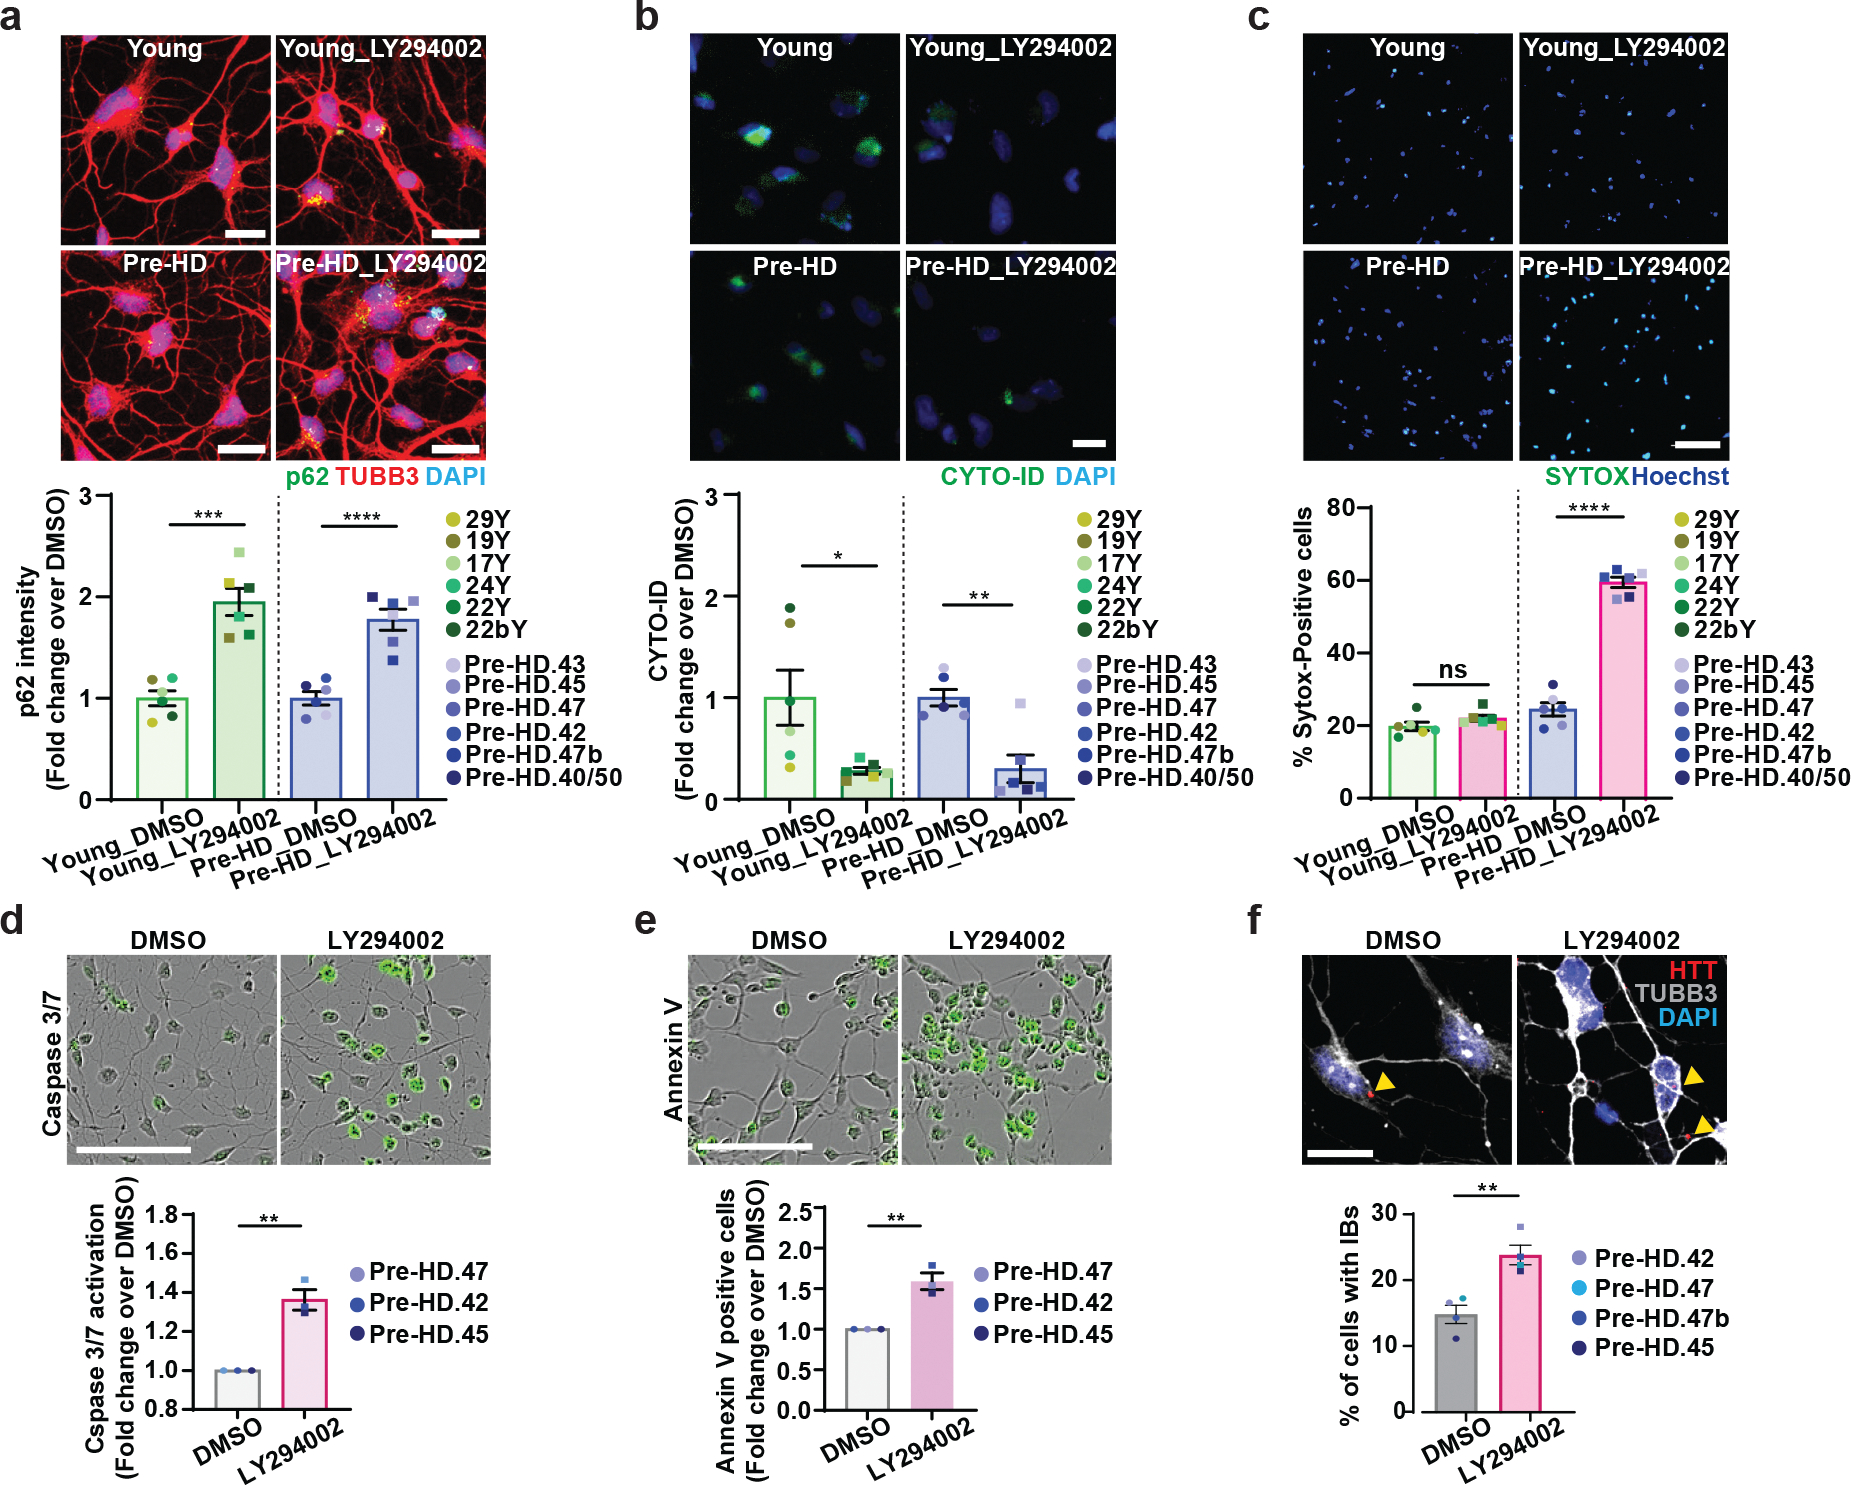
Fig. 3. Autophagy inhibitor induces neurodegeneration of pre-HD-MSNs.

a-c, Representative images of p62 and TUBB3-positive cells (top) and quantification of p62 intensity per cell (bottom) at PID26 (a, n=12 individual’s reprogrammed MSNs, ***p=0.0001, ****p<0.0001), representative images of CYTO-ID green signals (top) and quantification of CYTO-ID signals per cell (bottom) at PID26 (b, n=12 individual’s reprogrammed MSNs, *p=0.0253, **p=0.0013), and representative images of SYTOX staining (top) and quantification of SYTOX-positive cells as a fraction of Hoechst-positive cells (bottom) at PID30 (c, n=12 individual’s reprogrammed MSNs, ****p<0.0001) from multiple healthy control young and pre-HD-MSNs treated with DMSO or 50 μM LY294002. d,e, Representative images (top) and quantification (bottom) of caspase activation (green) at PID 26 (d, n=3 individual’s reprogrammed MSNs, **p=0.0023) and Annexin V signal (green) at PID 30 (e, n=3 individual’s reprogrammed MSNs, **p=0.0045) from three pre-HD-MSN lines treated with DMSO or 50μM LY294002. f, Representative images (top) and quantification (bottom) of HTT inclusion bodies (IBs) present in pre-HD-MSNs treated with DMSO or 50μM LY294002 (four pre-HD-MSNs lines; DMSO: 3947 cells, 50μM LY294002: 4314 cells, PID30), (n=4 individual’s reprogrammed MSNs, **p=0.0075). For all figures shown (a-f), statistical significance was determined using two-tailed unpaired t-test; ****p<0.0001, ***p<0.001, **p<0.01, *p<0.05. Scale bars in a,b,f 20μm; in c,d,e 100μm. Mean±s.e.m.
