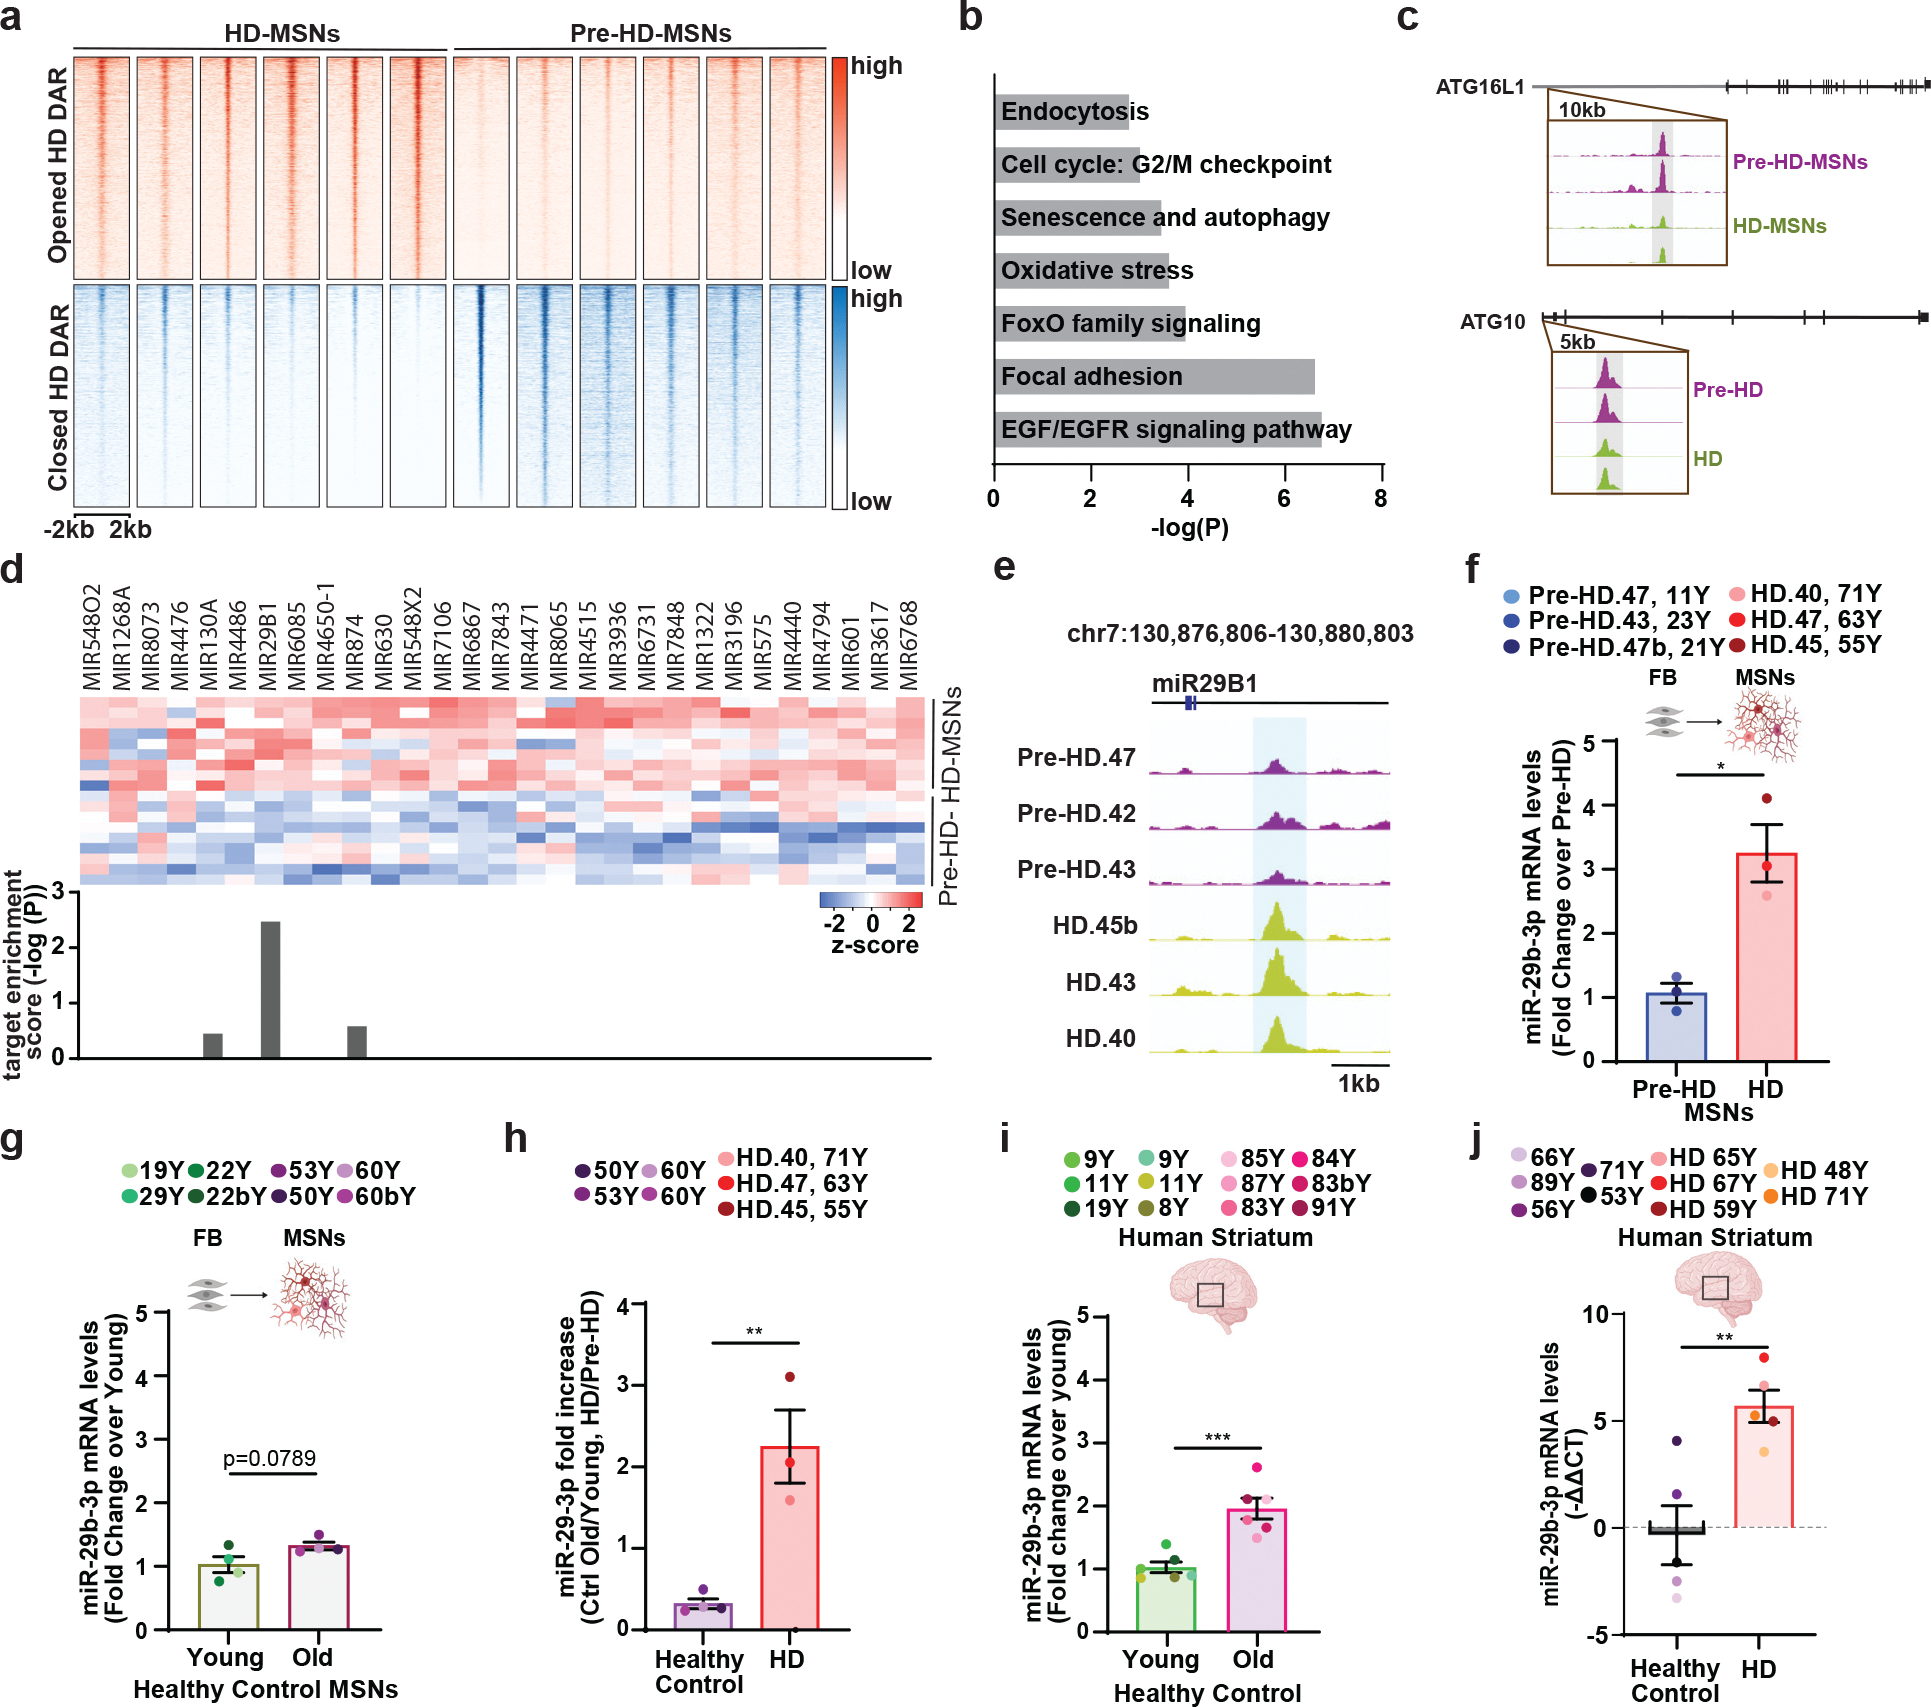
Fig. 5. Comparative analysis of chromatin accessibility between pre-HD- and HD-MSNs.

a, Heatmaps showing signal intensities of ATAC-seq peaks for DARs detected between pre-HD-MSNs and HD-MSNs at PID21 (adj. p<0.05, │log2FC│>1). b, Pathway enrichment for genes associated with DARs at promoter regions in pre-HD-MSNs and HD-MSNs at PID21 (adj. p<0.05) by BioPlanet analysis. c, Integrative Genomics Viewer (IGV) snapshots showing DAR peaks (blue highlight) are more accessible in pre-HD-MSNs (purple) compared to HD-MSNs (green). ATG16L1 and ATG10 are shown as these genes are involved in senescence and autophagy. d, Heatmap representation of ATAC-seq signal intensities for promoter regions of miRNA precursors opened in HD-MSNs. Target enrichment score (log(p-value)) of miRNA precursors for the brown module. e, Integrative Genomics Viewer (IGV) snapshots showing peaks enriched in HD-MSNs (green) over pre-HD-MSNs (purple) within miR29B1 (DAR highlighted in blue). f, RT-qPCR analysis of mature miR-29b-3p expression in three independent pre-HD- and HD-MSNs at PID 26 (*p=0.0100). g, RT-qPCR analysis of mature miR-29b-3p expression in four independent healthy control young and old Ctrl-MSNs at PID 26. h, Fold changes of increase of miR-29–3p levels in old versus young Ctrl-MSNs, and HD-MSNs versus pre-HD-MSNs, replotted from f and g (n=7 individual’s reprogrammed MSNs, **p=0.0039). i, RT-qPCR analysis of mature miR-29b-3p expression in human young striatum aged 8, 9, 11, and 19 years and human old striatum aged 83, 84, 85, 87, and 91 years (n=12 individual’s striatum, ***p=0.0005). j, RT-qPCR analysis of mature miR-29b-3p expression in human healthy control striatum (53, 71, 56, 89, and 66 years of age) and human Huntington’s disease patient’s striatum (59, 67, 48, 71 and 65 years of age), (n=10 individual’s striatum, **p=0.0050). For f-j figures shown, statistical significance was determined using two-tailed unpaired t-test; ***p<0.001, **p<0.01, *p<0.05. Mean±s.e.m.
