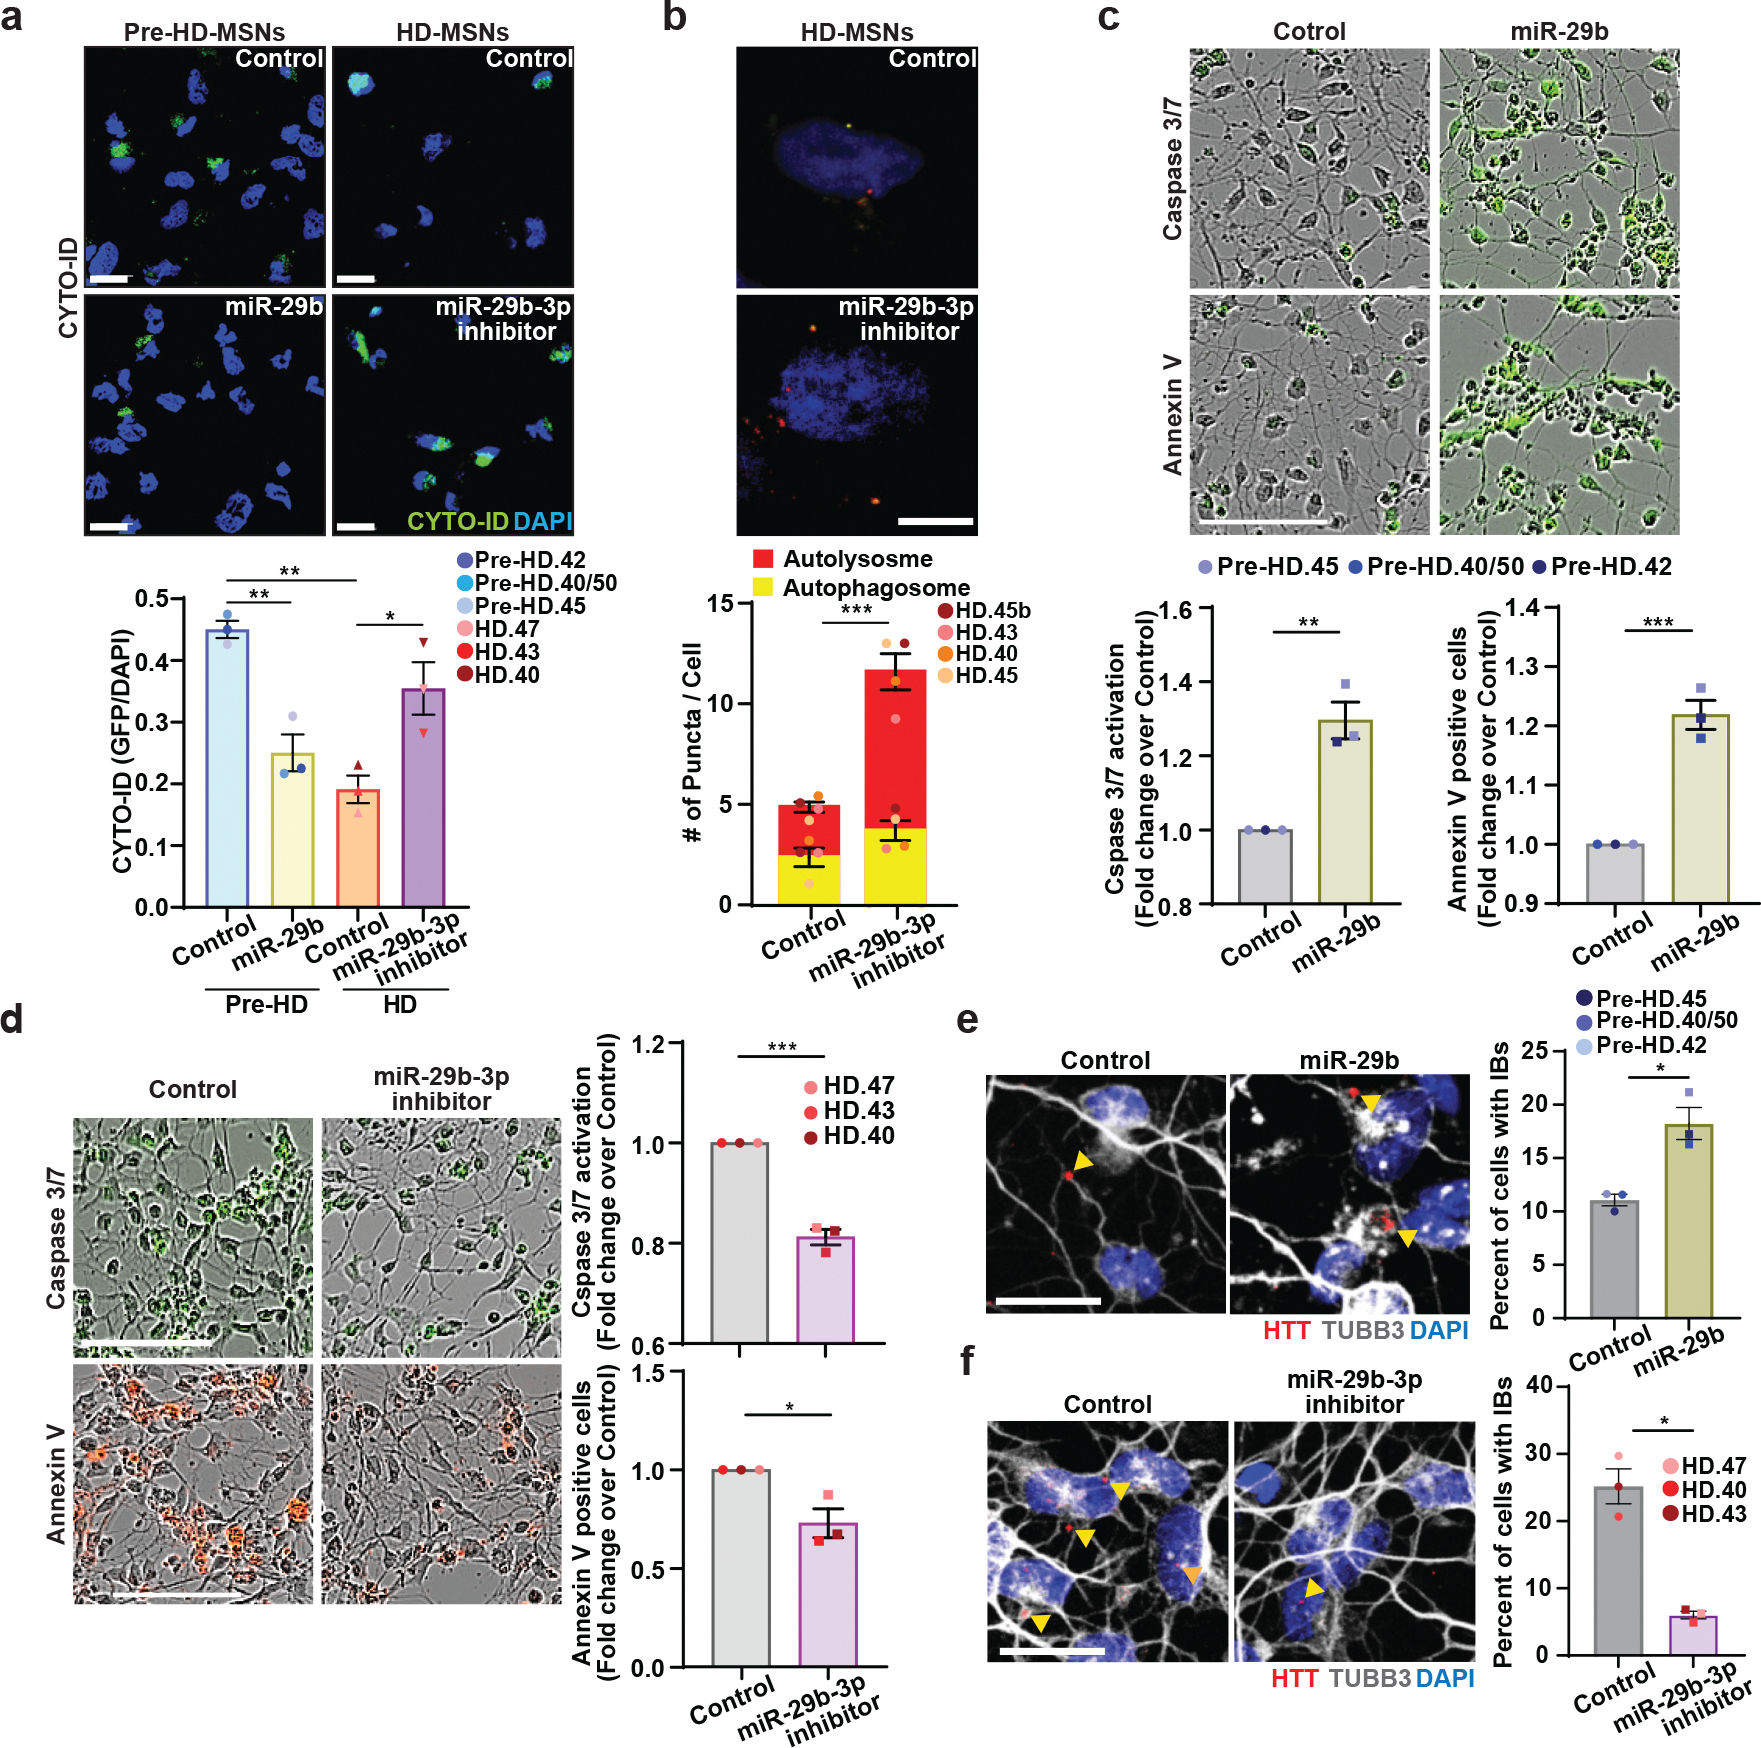
Fig. 6. Inhibition of miR-29b-3p enhances autophagy and rescues HD-MSNs from degeneration.

a, Representative images (top) and quantification (bottom) of CYTO-ID green signals from pre-HD-MSNs expressing control or miR-29b (control: 353 cells, miR-29b: 392 cells) and HD-MSNs with control or miR-29b-3p inhibitor (control: 380 cells, miR-29b-3p inhibitor: 421 cells) at PID26 (n=6 individual’s reprogrammed MSNs, Pre-HD Control vs. miR-29b **p=0.0054, HD Control vs. miR-29b-3p inhibitor *p=0.0172, Pre-HD Control vs. HD Control **p=0.0010). b, Representative images (top) of HD-MSNs expressing the tandem monomeric mCherry-GFP-LC3 reporter with control or miR-29b-3p inhibitor. Quantification (bottom) of autophagosome (i.e., mCherry+, GFP+ puncta) and autolysosome (i.e., mCherry+, GFP− puncta) compartments from four independent HD-MSNs. Measurements were performed in cells having at least 3 puncta per cell (from more than 50 cells per MSN line, ***p=0.0004). c,d, Representative images (top) and quantification (bottom) of caspase3/7 activation at PID 26 and Annexin V signal at PID 30 from three independent pre-HD-MSN lines expressing control or miR-29b (c, **p=0.0040, ***p=0.0009). Representative images (left) and quantification (right) of caspase3/7 activation at PID 26 and Annexin V signal at PID 30 from three independent HD-MSN lines with control or miR-29b-3p inhibitor (d, ***p=0.0003, *p=0.0209). e,f, Representative images (left) and quantification (right) of HTT inclusion bodies from three independent pre-HD-MSNs expressing control or miR-29b (e, *p=0.0355) (control: 437 cells, miR-29b: 389 cells) and three independent HD-MSNs with control or miR-29b-3p inhibitor (f, *p=0.0136) (control: 406 cells, miR-29b-3p inhibitor: 630 cells) at PID30. For all figures shown, statistical significance was determined using one-way ANOVA (a) and two-tailed unpaired t-test (b-f); ***p<0.001, **p<0.01, *p<0.05. Scale bars in b 10μm; in a, e, f 20μm; in c, d 100μm. Mean±s.e.m.
