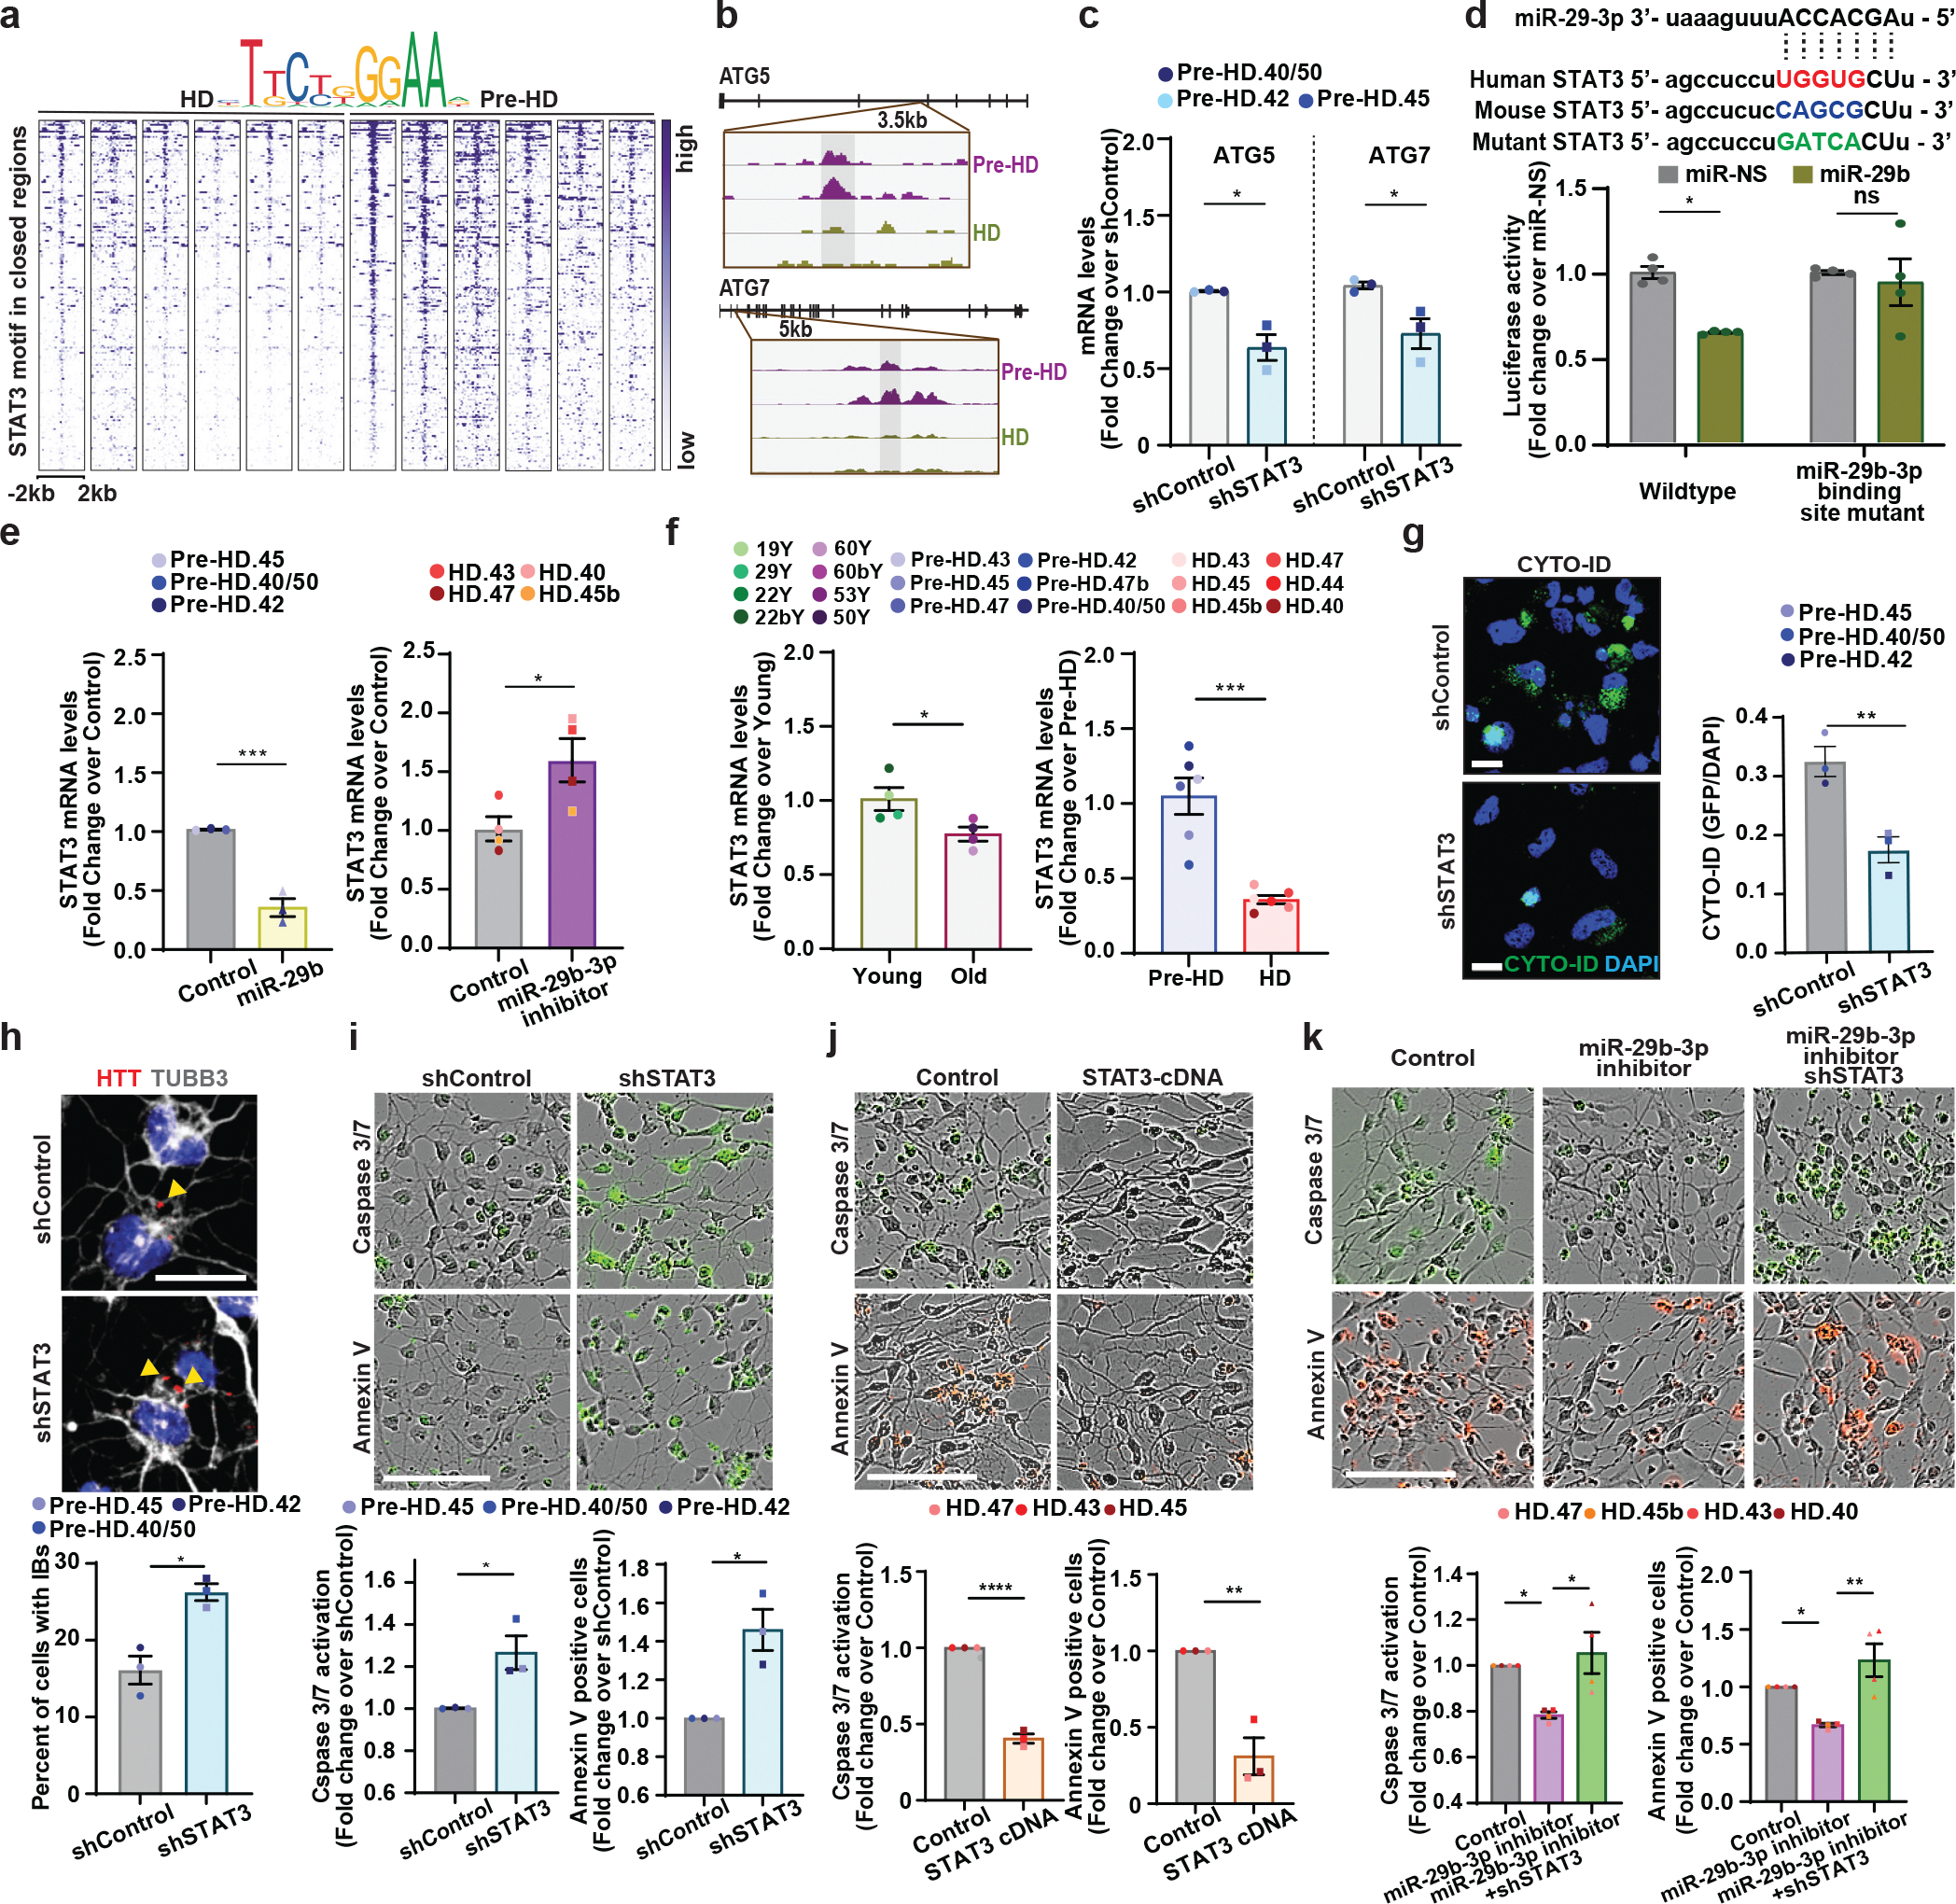
Fig. 7. Inhibition of miR-29b-3p-STAT3 axis enhances autophagy and rescues HD-MSNs from degeneration.

a, Heatmaps of STAT3 binding site intensity within chromatin loci closed in HD-MSNs. Legend depicts representative motifs for STAT3 binding sites. b, Integrative Genomics Viewer (IGV) snapshots showing DAR peaks (blue highlight) are more accessible in pre-HD-MSNs (purple) compared to HD-MSNs (green). ATG5 and ATG7 contained the STAT3 binding motif. c, RT-qPCR analysis of ATG5 and ATG7 mRNA levels in three independent pre-HD-MSNs expressing shControl or shSTAT3 at PID26. Each dot represents one individual’s reprogrammed MSN (ATG5 *p=0.011954, ATG7 *p=0.034887). d, Top: the sequence of miR-29–3p seeds in human and mouse STAT3 3’UTR and human STAT3 3’UTR mutant. Bottom: luciferase assays with HEK293Le cells co-transfected miR-NS or miR-29b-3p and wild-type or mutant of STAT3 3′UTRs containing point mutations to the seed-match regions of miR-29b-3p. The sample size (n) corresponds to the number of biological replicates (n=4, *p=0.0197). e, RT-qPCR analysis of STAT3 expression in three independent pre-HD-MSNs expressing control or miR-29b (left) and four independent HD-MSNs expressing negative control or miR-29–3p inhibitor (right) at PID26 (***p=0.0010, *p=0.0330). f, RT-qPCR analysis of STAT3 expression in four independent healthy control young- and old-MSNs, six independent pre-HD- and HD-MSNs at PID21 (*p=0.0395, ***p=0.0003). g, h, Representative images (left, top) and quantification (right, bottom) of Cyto-ID green signals (g, **p=0.0089) and HTT inclusion bodies (IBs) (h, *p=0.0300) from three independent pre-HD-MSNs expressing shControl or shSTAT3 (for Cyto-ID, shControl: 498 cells, shSTAT3: 404 cells. for HTT inclusion bodies, control: 260 cells, miR-29b: 346 cells). i, j, Representative images (top) and quantification (bottom) of caspase3/7 activation (green) at PID 26 and Annexin V signal (green or red) at PID 30 from three independent pre-HD-MSN lines expressing shControl or shSTAT3 (i, left *p=0.0306, right *p=0.0126) and three independent HD-MSN lines expressing control or STAT3 cDNA (j, left ****p<0.0001, right **p=0.0047). k, Representative images (top) and quantification (bottom) of caspase3/7 activation (green, left ****p<0.0001, right **p=0.0047) at PID 26 and Annexin V signal (red, left *p=0.0415, right *p=0.0133) at PID 30 from four independent HD-MSN lines expressing control, miR-29b-3p inhibitor or shSTAT3. Each dot represents one individual’s reprogrammed MSN in e,f,g,h,i,j,k. For all figures shown, statistical significance was determined using one-way ANOVA (c,k) and two-tailed unpaired t-test (d,e,f,g,h,i,j). ****p<0.0001, ***p<0.001, **p<0.01, *p<0.05, ns, not significant. Scale bars in g, h 20μm; in i, j, k 100μm; Mean±s.e.m.
