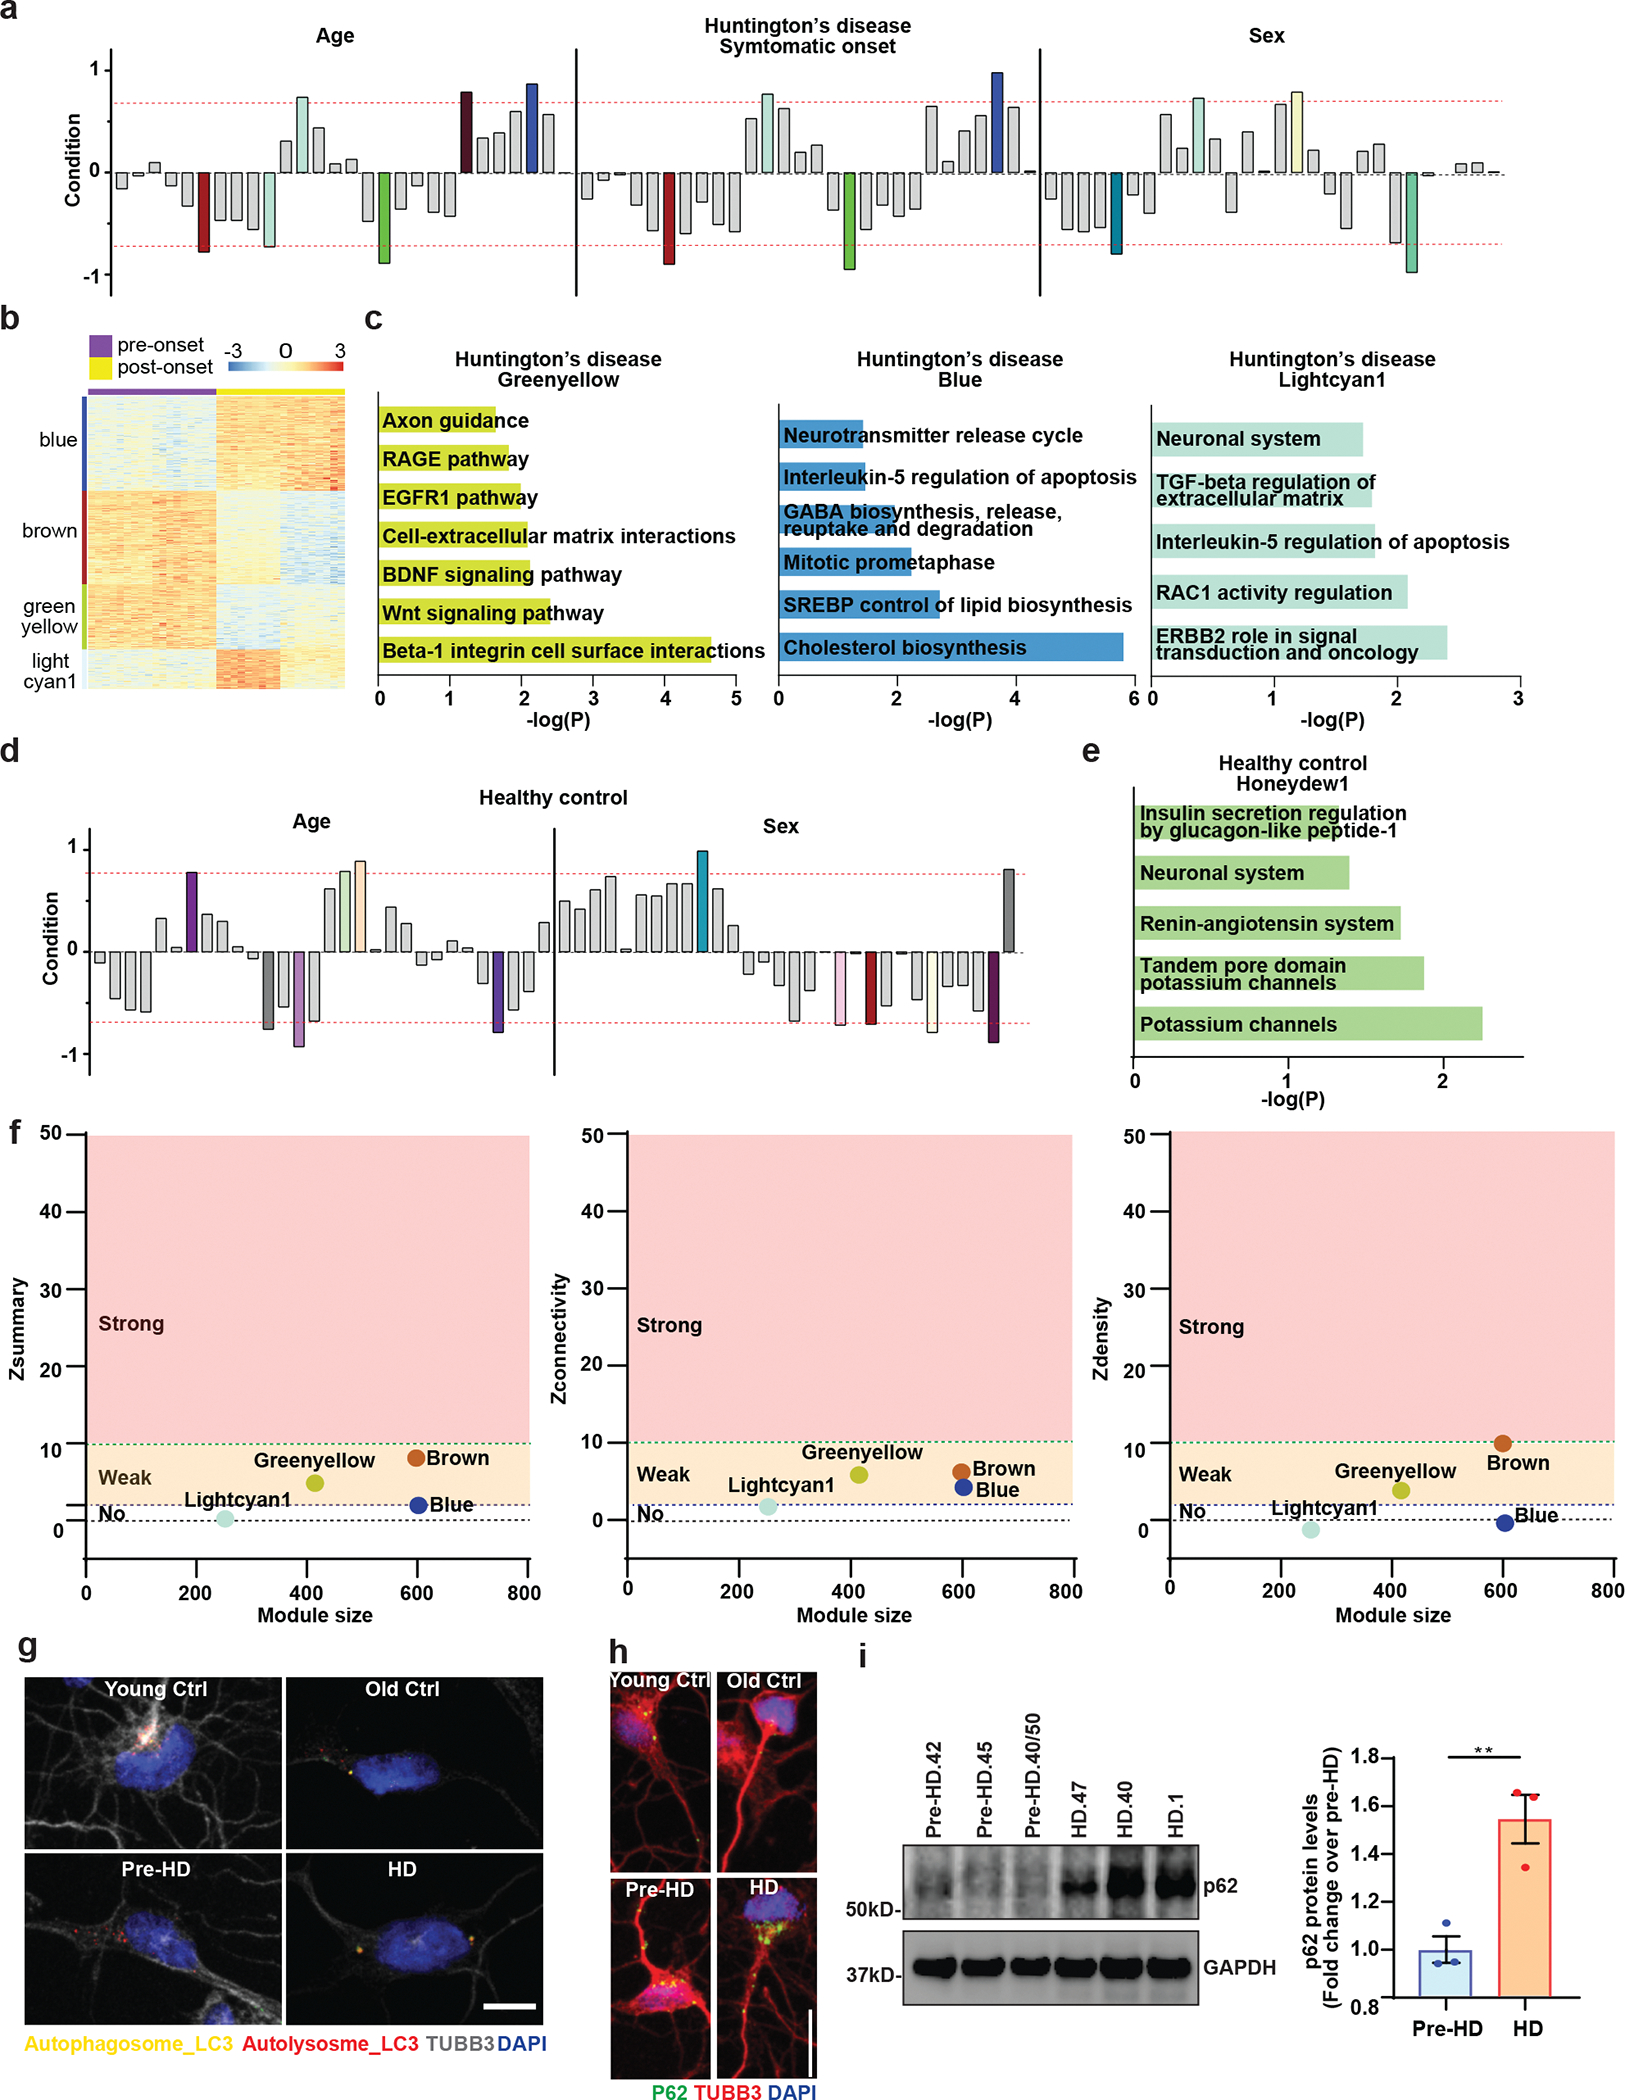
Extended Data Fig. 2. Genetic networks altered in HD-MSNs by WGCNA.

a, The signed association of protein-coding genes with Age, Symptomatic onset, and Sex condition of Huntington’s disease. Modules with positive values indicate increased expression in HD-MSNs; modules with negative values indicate decreased expression in HD-MSNs. The red dotted lines indicate correlation values of 0.7 or −0.7 with p=10–7 for age, p=10–6 for symptomatic onset, and p=10–6 for sex. b, An expression heatmap of our selected modules of HD samples (blue, lightcyan1, brown, and greenyellow) from WGCNA. c, Pathways enriched in downregulated (log2FC<−1) or upregulated (log2FC>1) genes in the greenyellow, blue and lightcyan1 module of Huntington’s disease by BioPlanet analysis. d, The signed association of protein-coding genes with age and sex of healthy control. Modules with positive values indicate increased expression in Old-MSNs; modules with negative values indicate decreased expression in Old-MSNs. The red dotted lines indicate correlation values of 0.7 or −0.7 with p=10–7 for age and p=10–6 for sex condition. e, Pathways enriched in upregulated (log2FC>1) genes in the honeydew1 module of healthy control by BioPlanet analysis. f, Summary preservation statistics as a function of the module size. Left: the composite preservation statistic (Zsummary), Middle: the connectivity statistics (Zconnectivity), Right: the density statistics (Zdensity). Each point represents a module, labeled by color. The dashed blue and green lines indicate the thresholds Z=2 and Z=10, respectively. g. Representative images of MSNs expressing the tandem monomeric mCherry-GFP-LC3 reporter immunostained for TUBB3. Autophagosome (i.e., mCherry+, GFP+ puncta) and autolysosome (i.e., mCherry+, GFP−puncta) compartments in MSNs from HD patients and control individual. Scale bar 20μm. h. Reprogrammed cells immunostained for p62 and TUBB3 from independent HD and healthy control lines. Scale bar 20μm. i. Immunoblot analysis for p62 and GAPDH of three independent pre-HD- and three independent HD-MSN lines at PID26. P62 signal intensities were normalized by GAPDH signals and relative fold changes in HD-MSNs were calculated over pre-HD-MSNs (**p=0.0019 by two-tailed unpaired t-test; Mean±s.e.m.).
