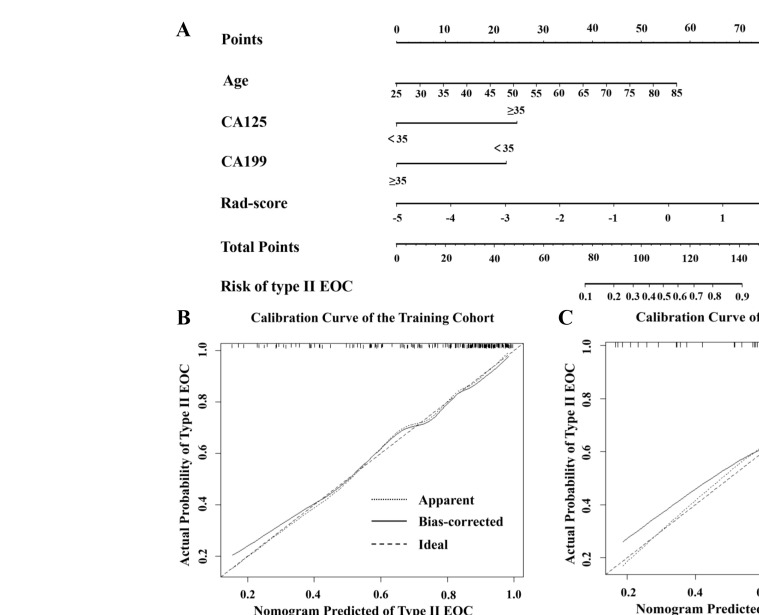
Figure 4.
(A) A clinical-radiomics nomogram was developed for predicting the probability of type II EOC with age, CA125, CA199, and Rad-score. To use this nomogram, the position of each variable on the corresponding axis is determined, and then, a line is drawn straight up to the points axis to obtain the score. Each score is added, and the total score is located on the total score axis. The total score is derived by calculating the scores of each variable and locating it on the total score axis. Then, the risk of type II EOC is determined at the lowest line of the nomogram. (B, C): Calibration curves analysis for the nomogram in predicting type II EOC in the training and test cohorts. The 45° dashed line represents a perfect prediction, the dotted line represents the actual performance by the nomogram in the training and test cohorts, and the solid lines represent bias correcting estimates employing 1,000 bootstrap sampling.

