Figure 6.
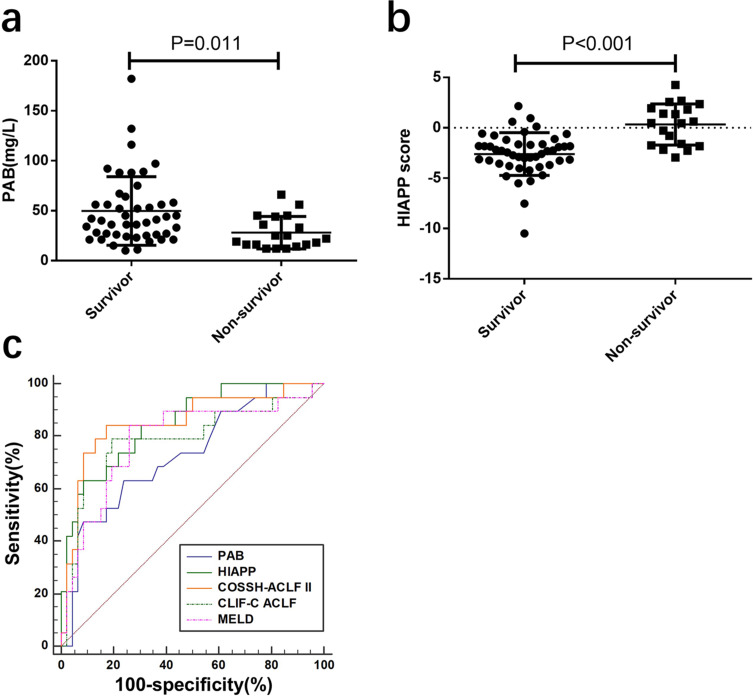
The performance of PAB, HIAPP, COSSH-ACLF II, CLIF-C ACLF and MELD for predicting the 30‐day mortality in the validation cohort (a) PAB level of non-survivor and survivor of HBV‐ACLF patients in the validation cohort. (b) HIAPP score of non-survivors and survivors in the validation cohort. (c) ROC analysis shows the performance of PAB, HIAPP, COSSH-ACLF II, CLIF-C ACLF, and MELD scores in the validation cohort.

