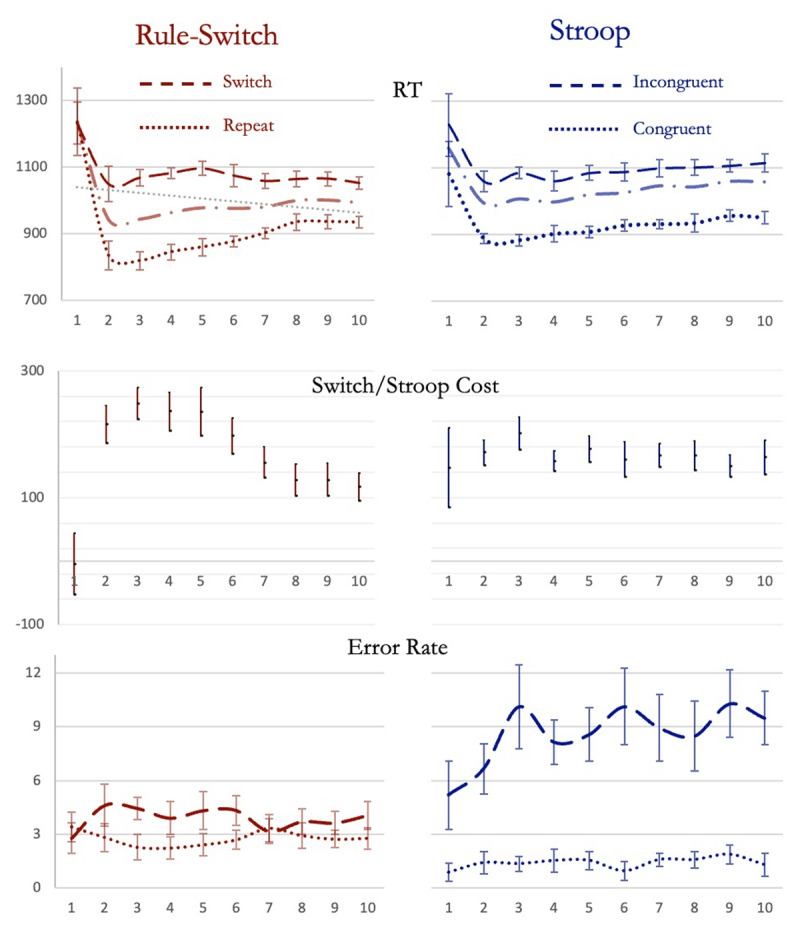
Figure 4.

(Experiment 1) Reaction times, Costs (rule-switching and Stroop) and Error rates from rule-switching (left column) and Stroop (right column) sessions. Dashed lines represent RTs and error rates on rule-switch or Incongruent Stroop-trials. Dotted lines represent these during rule-repeat and Congruent Stroop-trials. The gray dashed and dotted line in top graphs represent averaged reaction times. Error bars in this and all subsequent graphs depict 95% confidence intervals.
