. 2023 May 4;6(1):25. doi: 10.5334/joc.275

Figure 5.

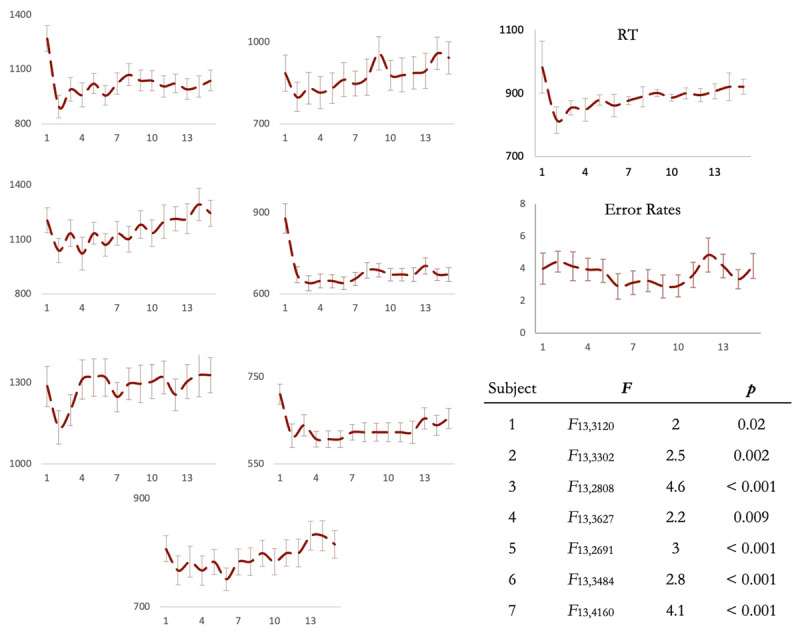
Figure 5 (Experiment 2) RT patterns across the seven participants. In each participant, RTs across trials 2 to 15 were significantly different (Table). The RT pattern after averaging across all participants (inset) was identical to that in Experiment 1. Error bars represent 95% confidence intervals.

(Experiment 2) RT patterns across the seven participants. In each participant, RTs across trials 2 to 15 were significantly different (Table). The RT pattern after averaging across all participants (inset) was identical to that in Experiment 1. Error bars represent 95% confidence intervals.