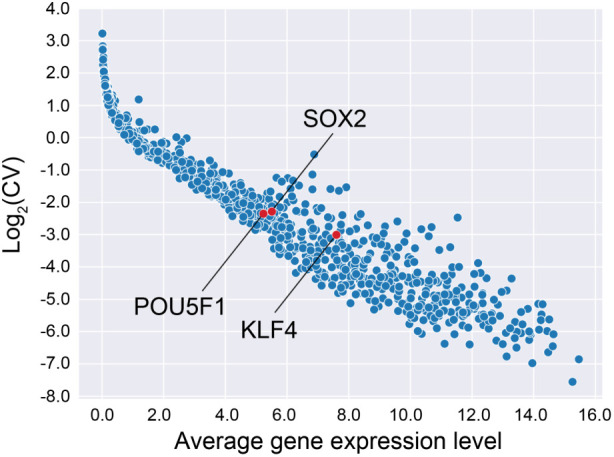
FIGURE 1:

Distribution of gene expression levels and variation across samples. Each dot represents a gene expression of a single gene. After filtering based on the average (X-axis) and CV (Y-axis) of the gene expression level, we retained 218 genes out of the 980 genes (top right quadrant), including three genes of particular interest (red dots).
