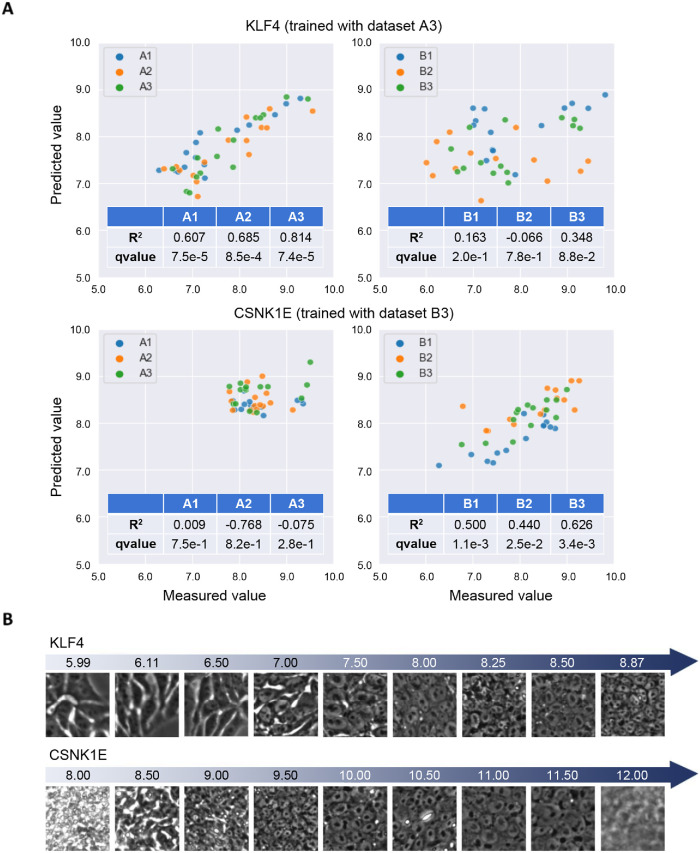
FIGURE 6:
Gene prediction results. (A) Prediction accuracy on each data set for KLF4 and CSNK1E. Predicted (y-axis) vs. measured (x-axis) expression levels (log2) for KLF4 and CSNK1E using the trained models as labeled. (B) Cell morphology and predicted gene expression levels for KLF4 and CSNK1E. The numbers represent the predicted gene expression levels corresponding to each image. The patches are collected from the data sets of experiments A and B for KLF4 and CSNK1E, respectively.

