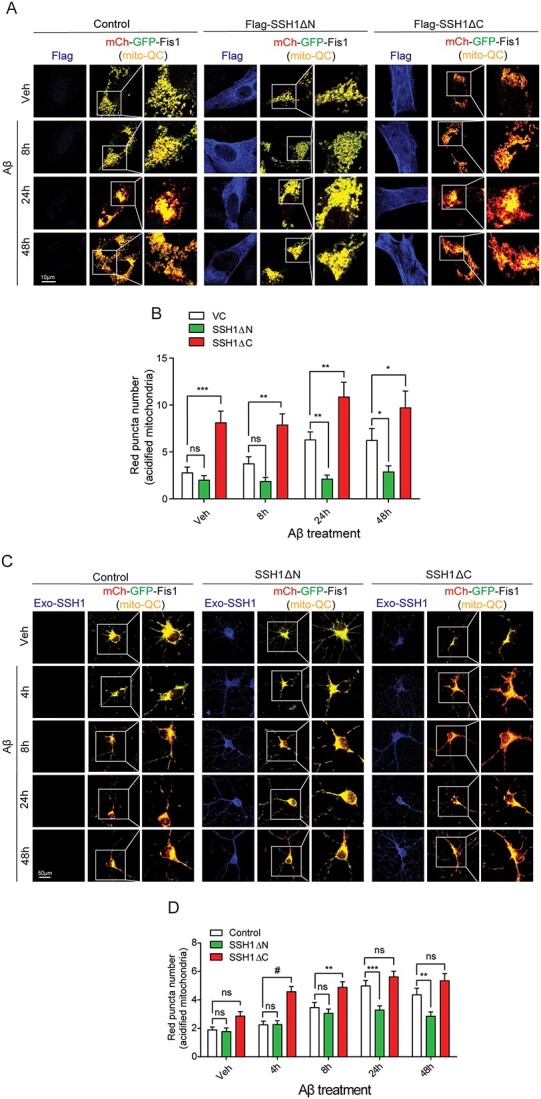
Figure 4.

SSH1 C-terminal but not N-terminal region suppresses mitophagy. (A) Representative images of HT22 cells co-expressing mito-QC (mCherry-GFP-Fis1) (red and green) and VC, Flag-SSH1ΔN or Flag-SSH1ΔC (blue), with 100 nm Aβ treatment for 8, 24 or 48 h. (B) Quantification of red (acidified) mito-QC puncta for A. Data are presented as mean ± SEM. n = 12–15 images/condition from three independent experiments, two-way ANOVA, followed by Dunnett’s post hoc, ***P < 0.0005, **P < 0.005, *P < 0.05. (C) Representative images of DIV18 mito-QC+/+ (red and green) primary hippocampal neurons transduced with Control, Flag-SSH1ΔN or CFP-SSH1ΔC AAV9 (blue) on DIV3, with 100 nm Aβ treatment for 4, 8, 24 or 48 h. (D) Quantification of red (acidified) mito-QC puncta for C. Data are presented as mean ± SEM. n = 12–15 images/condition from four independent experiments, two-way ANOVA, followed by Tukey’s post hoc, #P < 0.0001, ***P < 0.0005, **P < 0.005.
