
Figure 5.
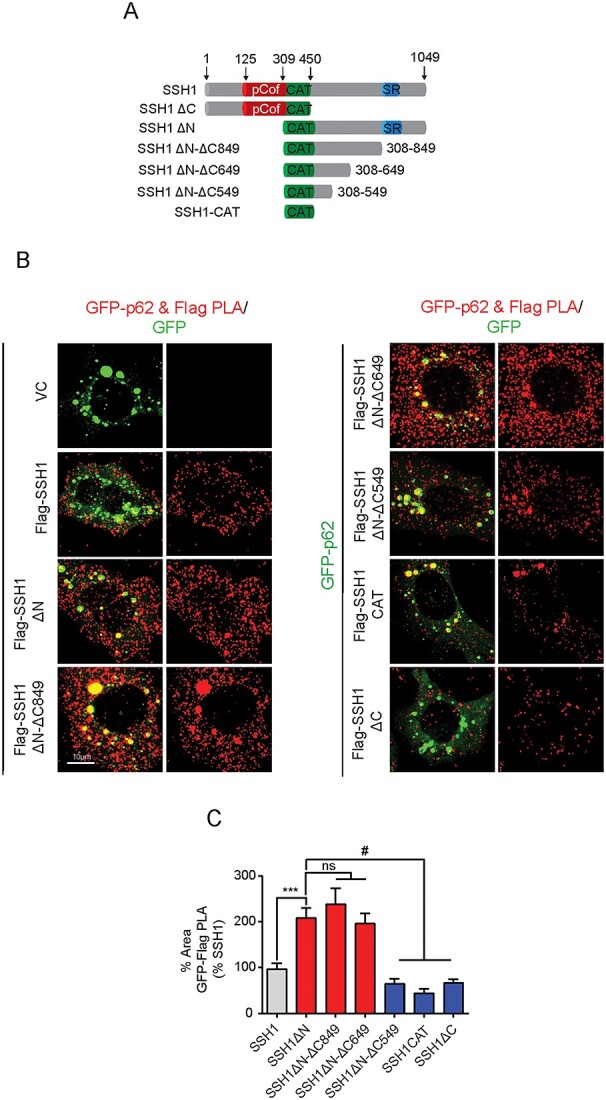
SSH1 residues 549–649 constitute the core p62-binding domain. (A) Schematic for SSH1 full length, SSH1 ΔC, SSH1 ΔN and the truncated forms of SSH1 ΔN generated to determine p62-binding site on SSH1. (B) Representative images of GFP-Flag PLA (red) on HT22 cells expressing the respective Flag tagged SSH1 constructs and GFP-p62 (green). (C) Quantification of the percentage of cell area occupied by Flag-GFP PLA from B. Data are presented as mean ± SEM. n = 10–12 images/condition from six independent experiments, one-way ANOVA, followed by Dunnett’s post hoc, #P < 0.0001, ***P < 0.0005.