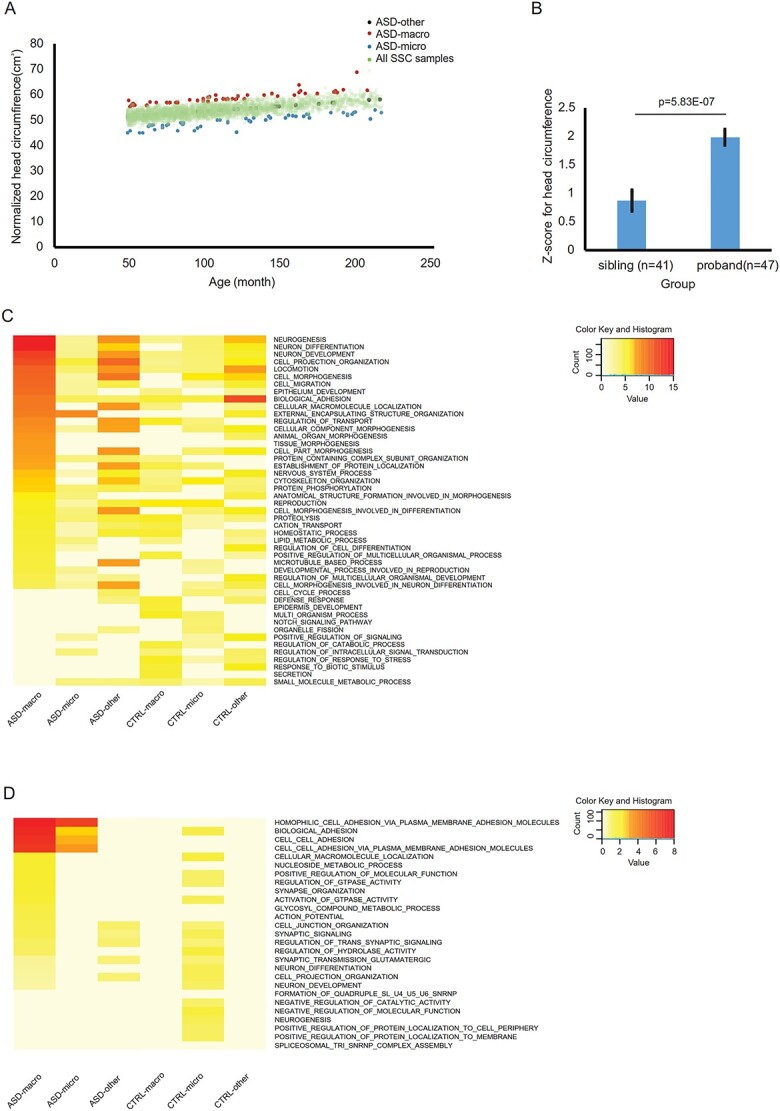
Figure 1.

SNV, INDEL and deletions in ASD with macrocephaly and microcephaly from the SFARI Simplex Simons Collection (SFARI-SSC) dataset. (A) ASD with macrocephaly (red dots) and microcephaly (blue dots) individuals with head circumference 2 SD greater than or 2 SD less than the mean were selected from 2760 ASD probands in the SSC dataset, whereas ASD with no brain size phenotype (‘ASD-other’, black dots) were selected from the individuals with head circumference closest to the mean. All other ASD probands were plotted as green dots. (B) Head circumferences of probands with macrocephaly were significantly larger than their siblings (P = 5.8E-07). (C) The top 15 significant GOs for genes that displayed significant enrichment for probands over siblings on the basis of exome sequencing (SNV and INDEL) data were selected. Adjusted P-value for top 15 significant GOs from each of ASD-macro, ASD-micro and ASD-others list was plotted from most to least significant for ASD-macro from top to bottom. The color scale was proportional to the -log transformed adjust P-value. (D) GOs for genes intersected with deletions found in probands but not control individuals. Adjusted P-value for top 20 GOs from each of ASD-macro, ASD-micro and ASD-other list was plotted. The color scale was proportional to the -log transformed adjust P-value.
