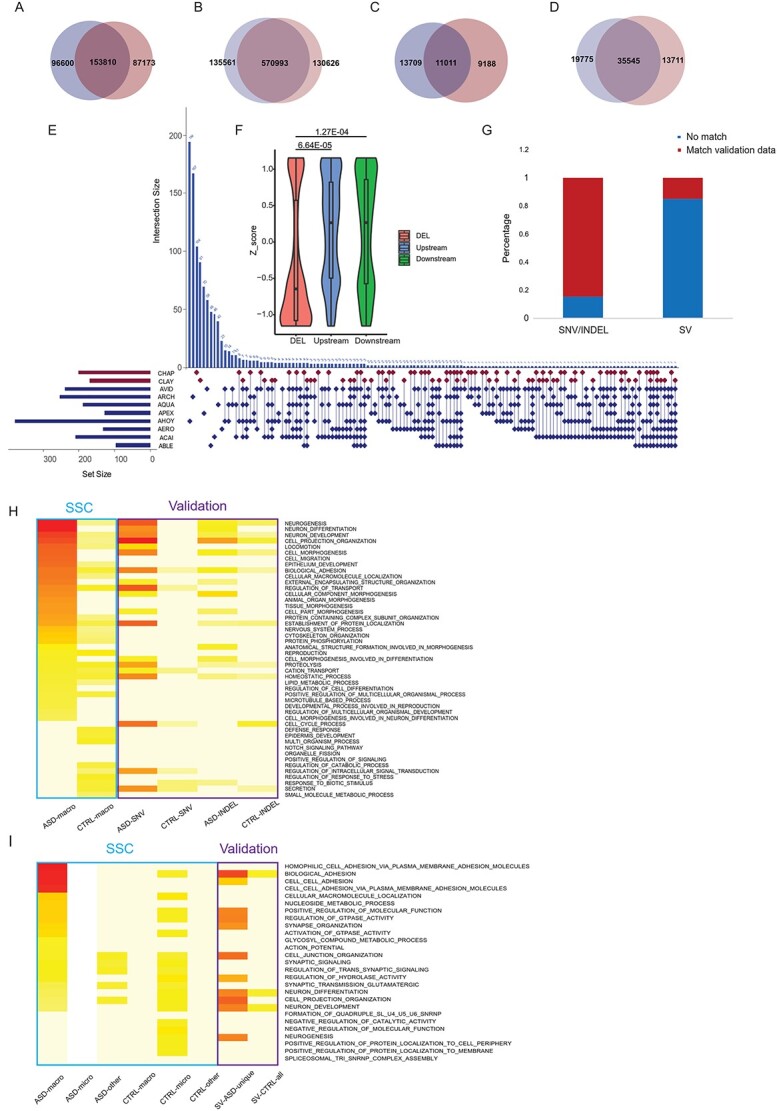
Figure 6.

SNVs INDELs and SVs in validation dataset. (A)–(D) Venn diagrams of number of loci detected in the validation dataset for SV events (A), Blue: ASDs, Red: Controls. SNV events (B), INDEL loci (C) and INDEL events (D). Blue: ASDs, Red: Controls. (E) SV (Deletions) detected in eight ASD with macrocephaly and two control individuals. Horizontal bar beside each sample name represents the total number of deletions detected in that sample. Control samples were in red and ASD samples in blue. Each row of the dot matrix corresponds to one sample and each column corresponds to one set of deletion loci with the same distribution pattern among these samples. Each vertical histogram bar represents the recurrence of a specific distribution pattern. Also, the recurrence number for each combination was labeled on top of the histogram bar. (F) Z-score of reading depth of exonic regions overlapped with deletions in ASD samples (red) demonstrated a significant reduction compared with genomic regions 10 KB upstream (blue) and downstream (green) of the deletion event. (G) The proportion of selected genomic loci from the SFARI-SSC dataset (as in Fig. 5B–D, nASD_macro = 1514, n asd_other = 410) that overlapped with the validation dataset. (H) GOs for genes with SNV/INDELs enriched in ASD from the validation dataset correspondingto top 15 GOs for each SFARI-SSC group (as in Fig. 1C). Color scale was proportional to -log transformed adjusted P-value. The blue rectangle depicted SFARI-SSC results; the purple rectangle depicted validation results. (I) GOs for genes with ASD-specific SVs from validation dataset corresponding to top 20 GOs for each SFARI-SSC group (as in Fig. 1D).
