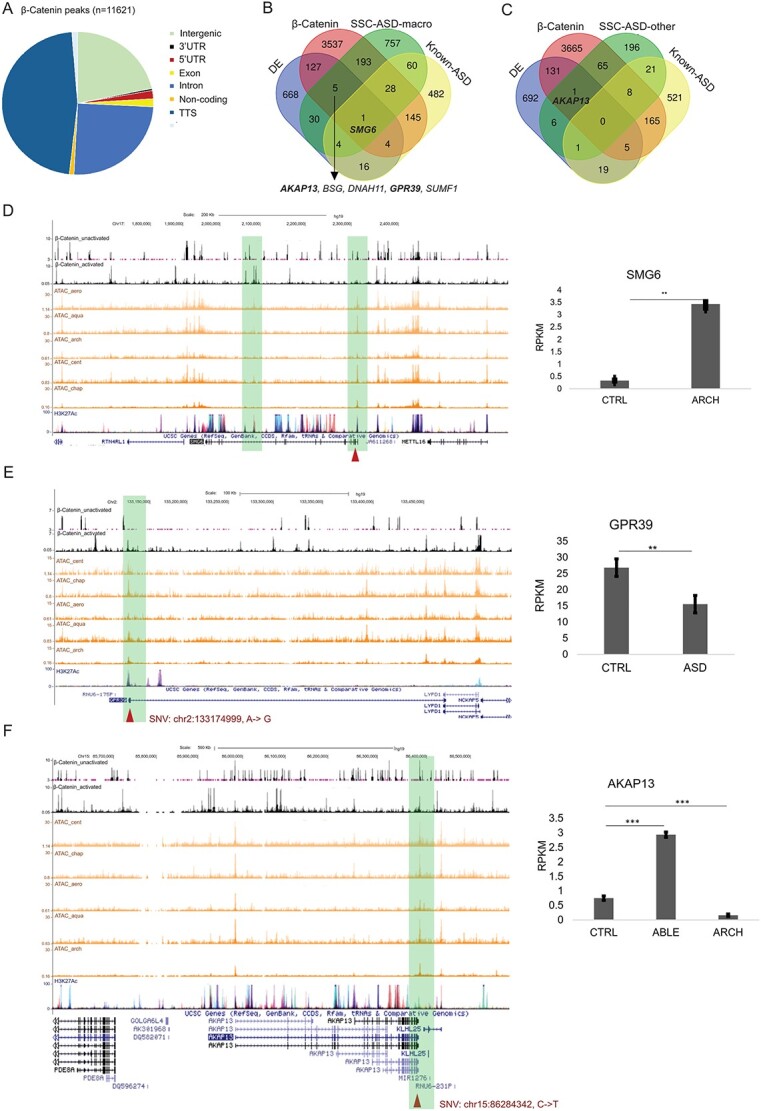
Figure 7.

Possible effect of selected loci on gene expression and β-catenin transcription regulation. (A) Functional annotation of β-catenin binding peaks. (B) Selected genomic loci from SFARI-SSC ASD-macro samples that overlapped with β-catenin targets, DE genes and known ASD genes. Genes with loci selected by gWGCNA pipeline, showing differential expression and bound by β-catenin, were listed below the Venn diagram. SMG6, which meets all these criteria and is a known ASD gene, was labeled in the Venn diagram. Names of loci selected to be plotted individually were bold. (C) Selected genomic loci from SFARI-SSC ASD-other samples overlapped with β-catenin targets, DE genes and known ASD genes. (D) Example plot for SNV (Chr17:2203025, T- > G) on SMG6, black tracks: β-catenin ChIPSeq (upper: inactivated, lower: activated by WNT3A); orange tracks: ATACseq data; purple track: H3K27Ac ChIPSeq from UCSC. Right panel: RPKM for ASD line with this variation (ARCH) and CTRL NPC lines. (E) SNV (Chr2:133174999, A- > G) on GPR39. Right panel: RPKM for ASD and CTRL NPC lines. (F) SNV (chr15:86284342, C- > T) on AKAP13. Right panel: RPKM for ASD line with this variation (ABLE and ARCH) and CTRL NPC lines. Significance level of difference in gene expression between ASD and CTRL group was indicated using asterisks on top of the bar (*P < 0.05, **P < 0.01, ***P < 0.001).
