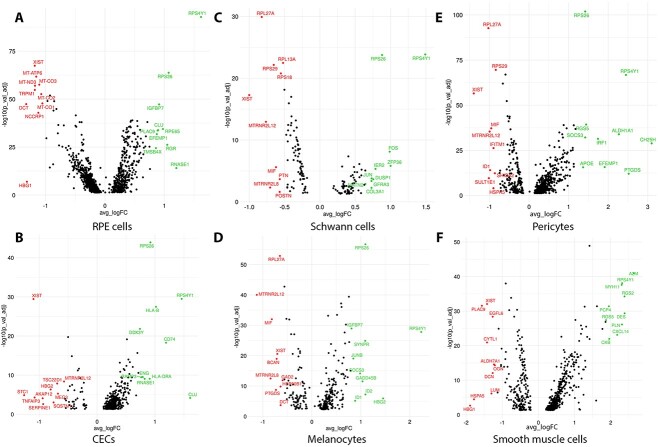
Figure 2.
Volcano plots showing differentially expressed genes between early and late fetal development in RPE cells (A), CECs (B), Schwann cells (C), melanocytes (D), pericytes (E) and smooth muscle cells (F). Top 10 upregulated and downregulated genes are shown in green and red colour, respectively. A false discovery rate (FDR) threshold of <0.05 was applied.

