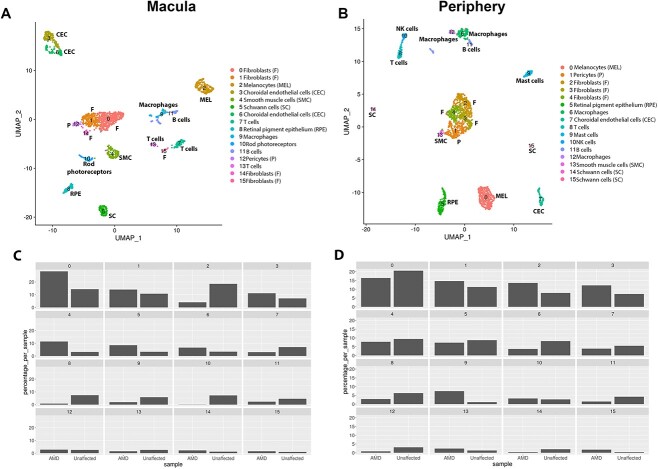
Figure 6.
Comparative single-cell RNA-Seq of macular and peripheral region of the intermediate AMD patient versus unaffected subject. (A) and (B) Integrated UMAP of macular (A) and peripheral (B) regions showing the presence of 16 cell clusters. (C) and (D) Cell type representation in RPE–choroid tissue in the macular (C) and peripheral (D) region. The subject identity is shown on the x axis and cluster number on top of each panel.

