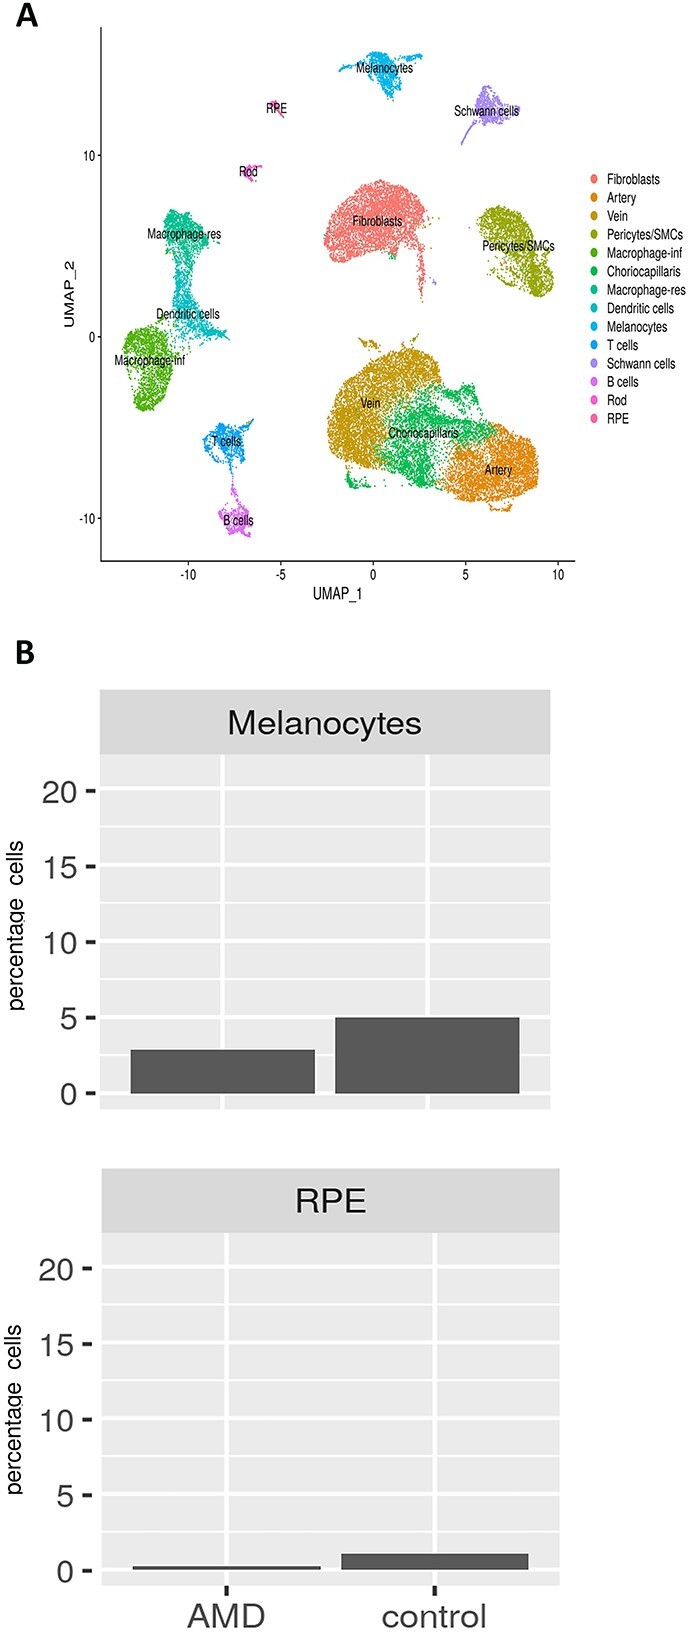
Figure 7.

Comparative single-cell RNA-Seq of RPE–choroid macular regions obtained from 12 AMD patients [one intermediate AMD presented in Figure 6 + nine early atrophic AMD (53) + two neovascular AMD (60)] and 11 unaffected controls [one control presented in Figure 6 + 10 additional controls (60)]. (A) Integrated UMAP of macular regions showing the presence of various cell clusters. (B) Cell type representation in RPE–choroid tissue in the macular region. The subject identity is shown on the x axis and cluster number on top of each panel.
