Figure 3.

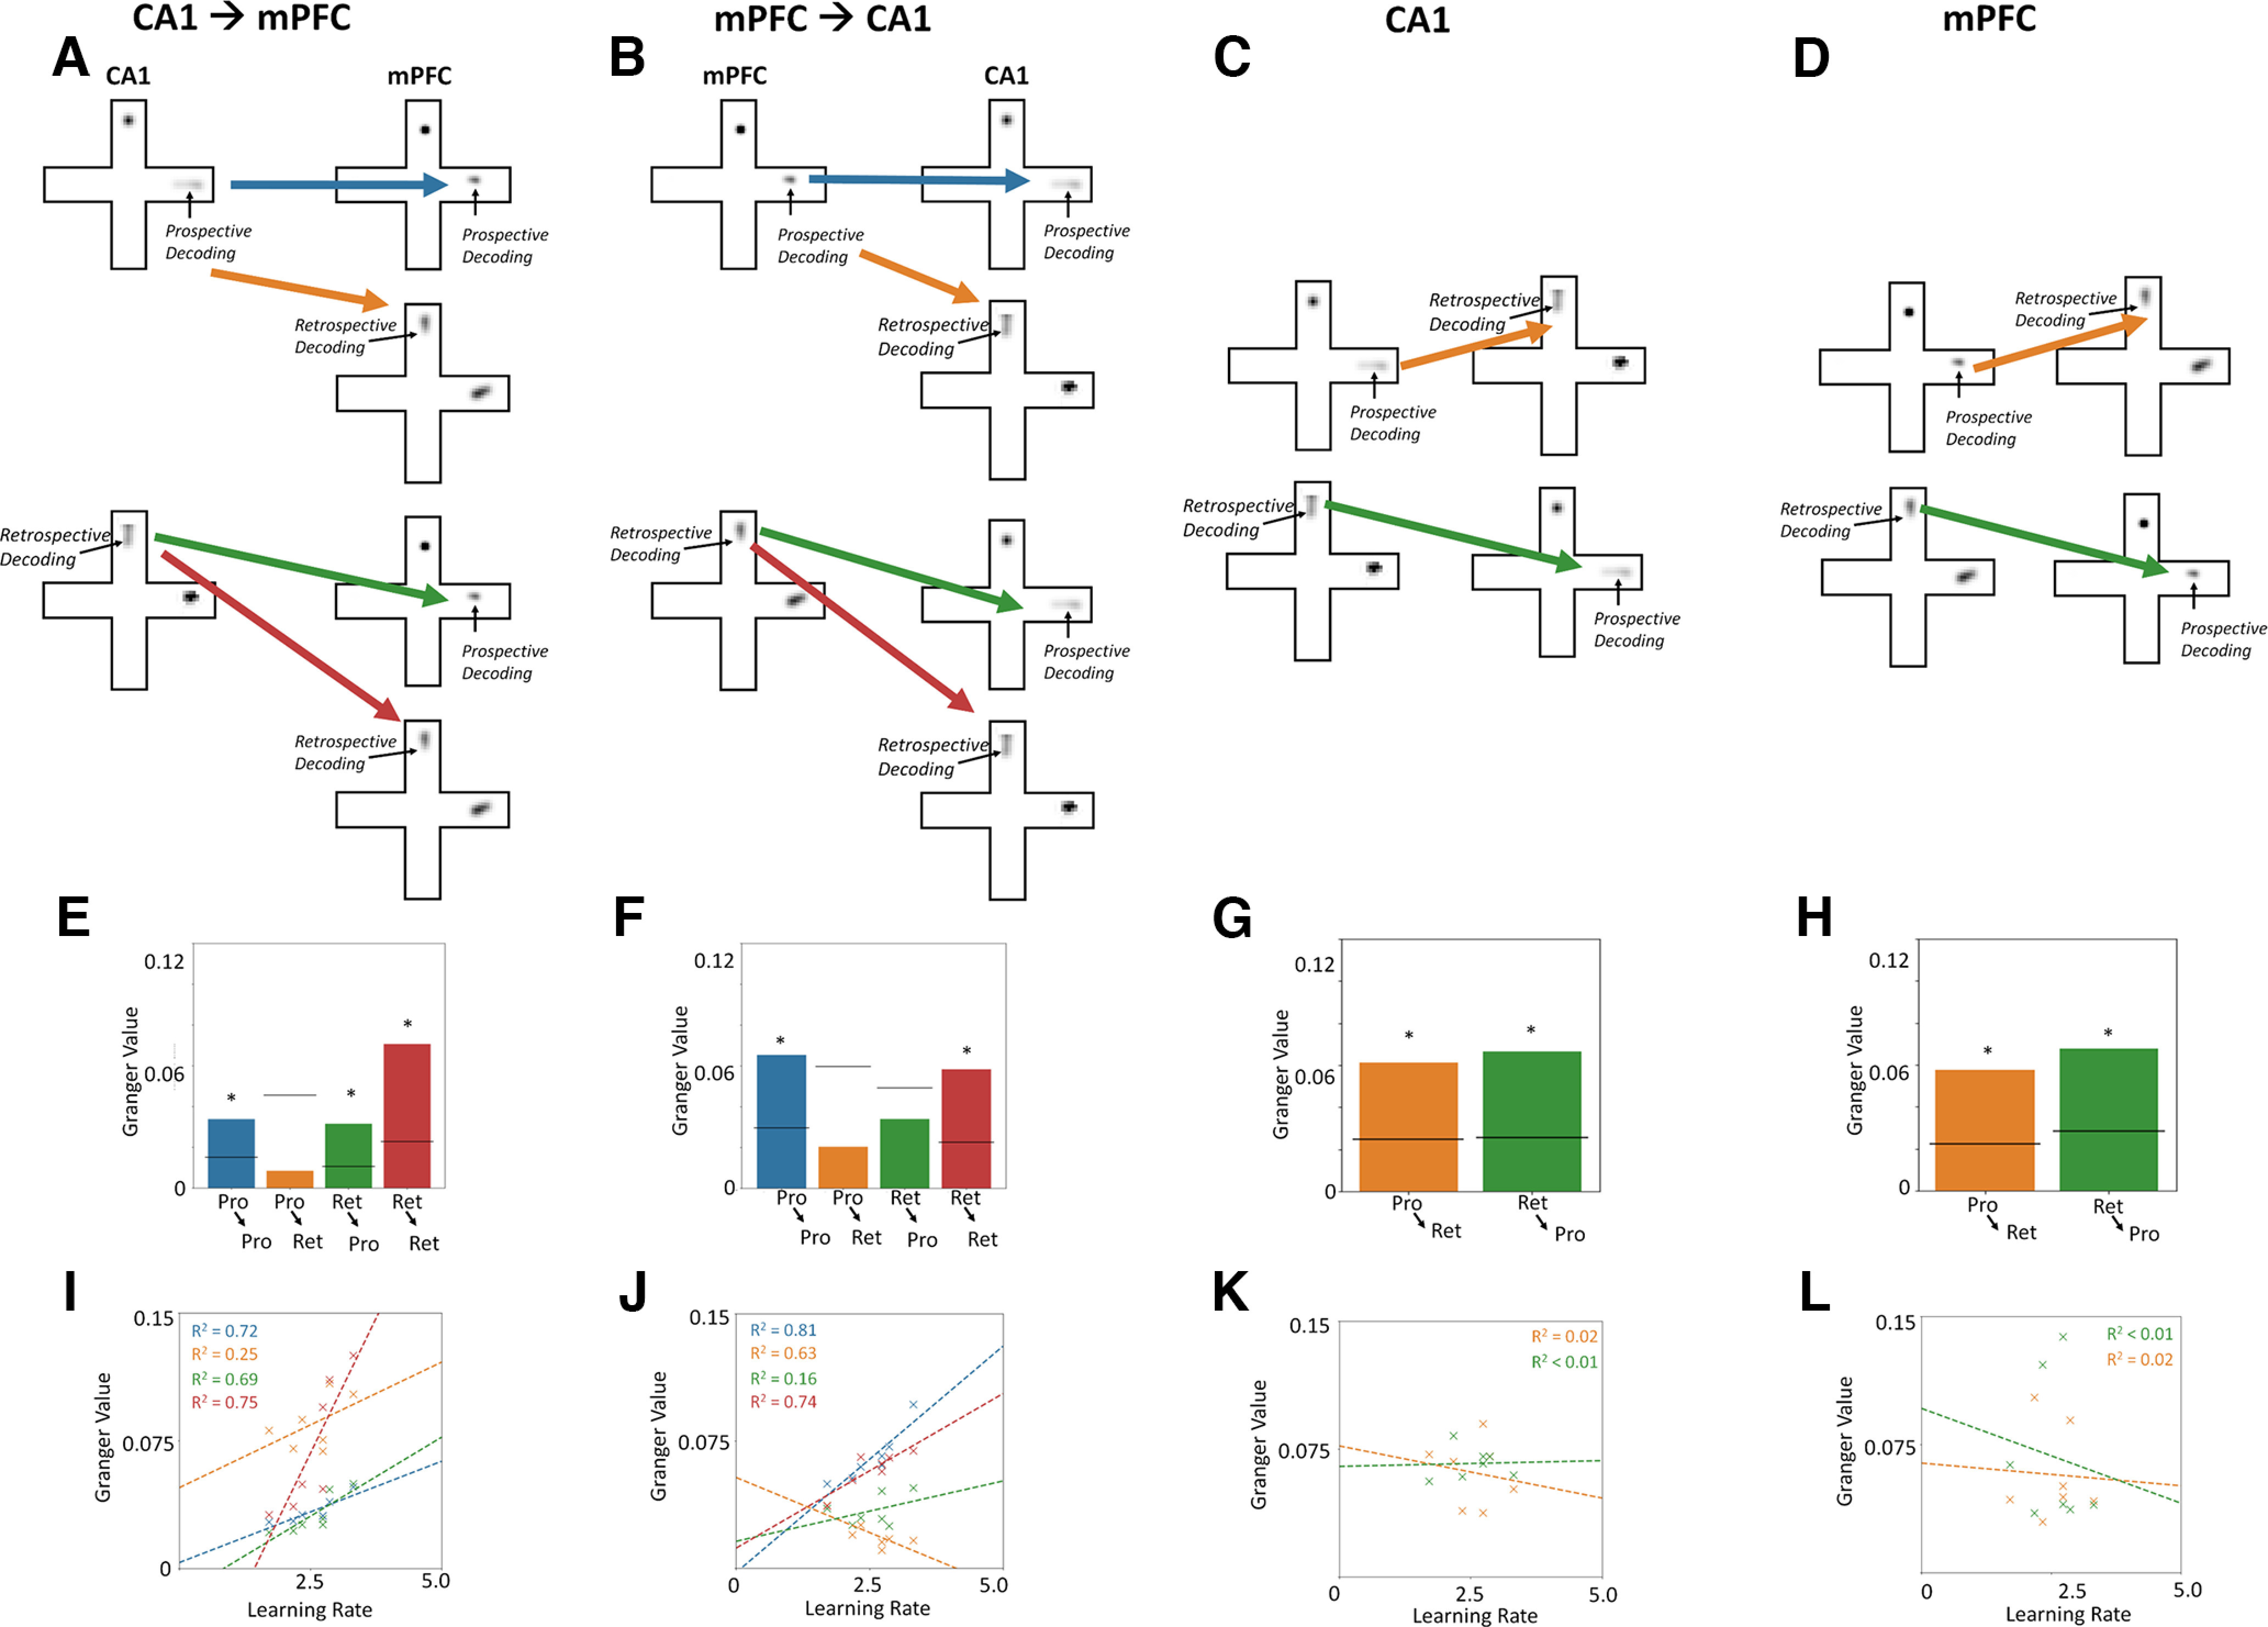
Bidirectional CA1-mPFC prospective and retrospective decoding interactions are correlated with learning, intrastructure interactions are not correlated with learning. A, Frontotemporal interaction schematics, CA1→mPFC. B, mPFC→CA1. Each type of frontotemporal decoding interaction is shown by a colored line; arrows (→) indicate the direction of information flow; blue, Prospective→Prospective; orange, Prospective→Retrospective; green, Retrospective→Retrospective; red, Retrospective→Prospective. C, D, Within-region interaction schematics, C, within CA1. D, Within mPFC. Each type of decoding interaction within a structure is shown by a colored line; orange, Prospective→Retrospective; green, Retrospective→Prospective. E, CA1 prospective decoding modulated mPFC prospective, but not retrospective, decoding (CA1Pro→mPFCPro, Granger value = 3.38%, p < 0.05; CA1Pro→mPFCRet, Granger value = 0.85%, p > 0.05). CA1 retrospective decoding modulated both retrospective and prospective decoding by mPFC (Granger values, CA1Ret→mPFCPro = 3.16%, p < 0.05; CA1Ret→mPFCRet = 7.07%, p < 0.05). F, mPFC prospective decoding modulated prospective, but not retrospective decoding by CA1 (Granger values, mPFCPro→CA1Pro = 6.55%, p < 0.05; mPFCPro→CA1Ret = 2.04%, p > 0.05). mPFC retrospective decoding did not influence current CA1 prospective decoding (mPFCRet→CA1Pro = 3.40%, p > 0.05) but did modulate CA1 retrospective decoding (mPFCRet→CA1Ret = 5.83%, p < 0.01). G, CA1 prospective and retrospective decoding modulated one another (CA1Pro→CA1Ret, Granger value = 6.13%; CA1Ret→CA1Pro, Granger value = 6.66%, p < 0.05). H, mPFC prospective and retrospective decoding modulated one another (mPFCPro→mPFCRet, Granger value = 5.74%; mPFCRet→mPFCPro, Granger value = 6.79%, p < 0.05). I, CA1 modulation of mPFC decoding predicted learning speed in three of four frontotemporal decoding interactions. The magnitude of modulation of CA1 retrospective decoding of mPFC prospective and retrospective decoding predicted learning speed (linear regression of decoding modulation times proportion contingency block complete before criterion, CA1Ret→mPFCPro, R2 = 0.69, p < 0.05; CA1Ret→mPFCRet, R2 = 0.75, p < 0.05). Modulation of CA1 prospective decoding of mPFC retrospective decoding did not vary with learning speed (CA1Pro→mPFCRet, R2 = 0.25, p > 0.05), but modulation of CA1 prospective decoding of mPFC prospective decoding did (CA1Pro→mPFCPro, R2 = 0.72, p < 0.05). J, mPFC prospective and retrospective decoding modulated CA1 prospective decoding and predicted learning speed (mPFCPro→CA1Pro, R2 = 0.81, p < 0.05; mPFCPro→CA1Ret, R2 = 0.63, p < 0.05). mPFC modulation of retrospective decoding of CA1 predicted learning (mPFCRet→CA1Ret, R2 = 0.74, p < 0.05), but mPFC's modulation of CA1 prospective decoding did not (mPFCRet→CA1Pro, R2 = 0.16, p > 0.05). K, L, Learning speed was unrelated to prospective or retrospective decoding interactions within CA1 (K, CA1Pro→CA1Ret, R2 = 0.03, p > 0.05; CA1Ret→CA1Pro, R2 < 0.01, p > 0.05) or mPFC (L, mPFCPro→mPFCRet, R2 < 0.01, p > 0.05; mPFCRet→mPFCPro, R2 = 0.02, p > 0.05). Bar colors in E–H represent the direction of frontotemporal (E, F) or intrastructure (G, H) decoding interactions, blue, Prospective (Pro)→Prospective; orange, Prospective→Retrospective (Ret); green, Retrospective→Prospective; red, Retrospective→Retrospective. Bar heights show the obtained Granger value, black lines represent the upper bound of the 95% confidence interval of the null distribution of Granger values obtained permutations; *p < 0.05. I–L, Individual crosses show the Granger values of single sessions, dashed lines show linear regression lines, and line colors indicate the four interactions as in E–H.
