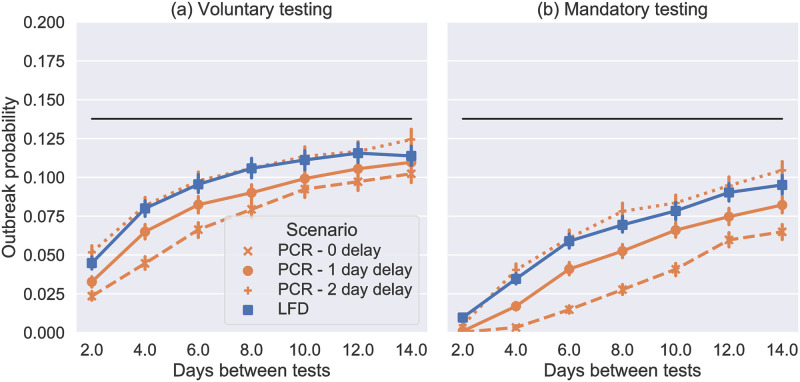
Fig 3. Probability of an outbreak in the model SPDD setting from a single introduction (selected at random), where the black line is the mean baseline case (no testing, estimated from 10,000 simulations).
Each coloured marker shows the mean result of 10,000 simulations with the labelled testing intervention. In (a) testing is not enforced so pmiss = 0.0 and and in (b) it is so pmiss = 0.0 and all people isolate with a positive test. In both cases we use pisol = 0.9 for symptomatic isolation.

