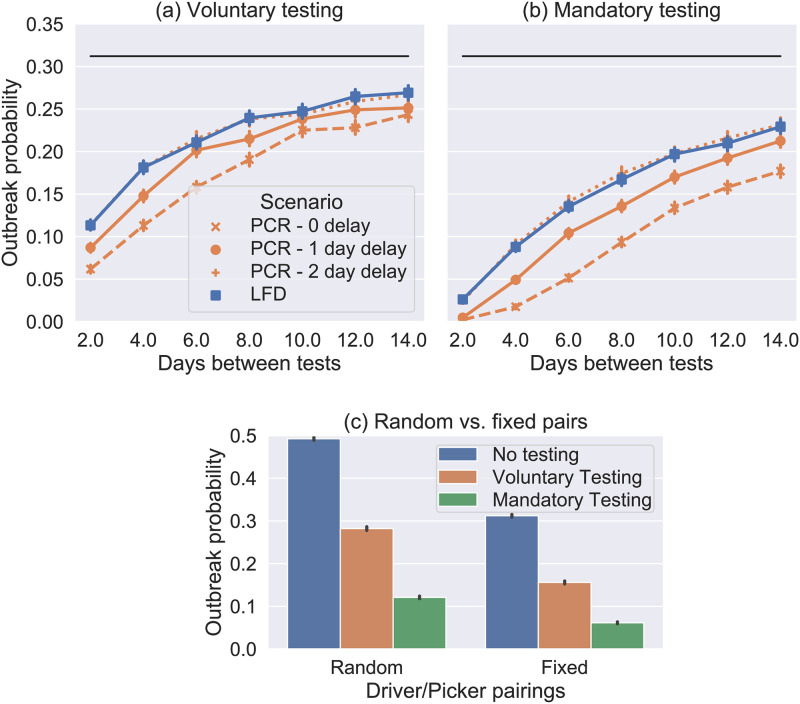
Fig 4.
(a) and (b) show the probability of an outbreak in the model LIDD setting from a single introduction (selected at random), where the black line is the mean baseline case (no testing, estimated from 10,000 simulations). Each coloured marker shows the mean result of 10,000 simulations with the labelled testing intervention assuming that the fixed pairings and pair isolation interventions are in place for drivers and loaders. In (a) testing is not enforced so pmiss = 0.4 and and in (b) it is so pmiss = 0.0 and all people isolate with a positive test. In both cases we use pisol = 0.9 for symptomatic isolation. (c) Bar graph comparing the outbreak of LFD antigen testing every 4 days in this setting showing both voluntary and enforced cases and both when the fixed pairings and pair isolation policies are and are not in place.

