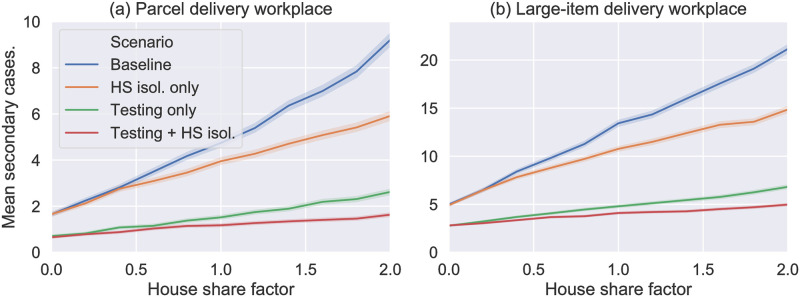
Fig 5. Mean number of secondary cases resulting from a single random introduction plotted against the house share factor H.
Different colour lines show the different intervention scenarios as labelled where “Testing” means LFD antigen testing every 3 days (with default adherence rates) and “HS isol.” means that the household isolation policy was implemented. (a) and (b) show the results for the two workplace types, as labelled. Each point plotted shows the mean of 10,000 simulations, with shaded error region estimated using a bootstrapping process [38].

