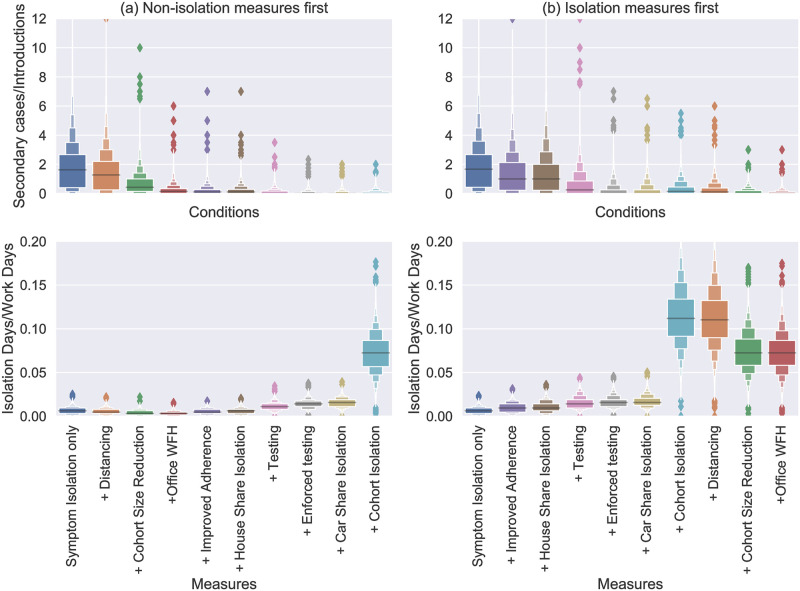
Fig 6. Boxen plots [38] of the number of secondary cases divided by the number of introductions in a SPDD workplace over a 3 month period.
Each distribution shows all the simulations (from 10000) with more than one introduction. The labels on the x-axis indicate the addition of an intervention (in-tandem with all the interventions to the left). In (a) the measures restricting contacts are introduced first and in (b) the isolation-based measure.

