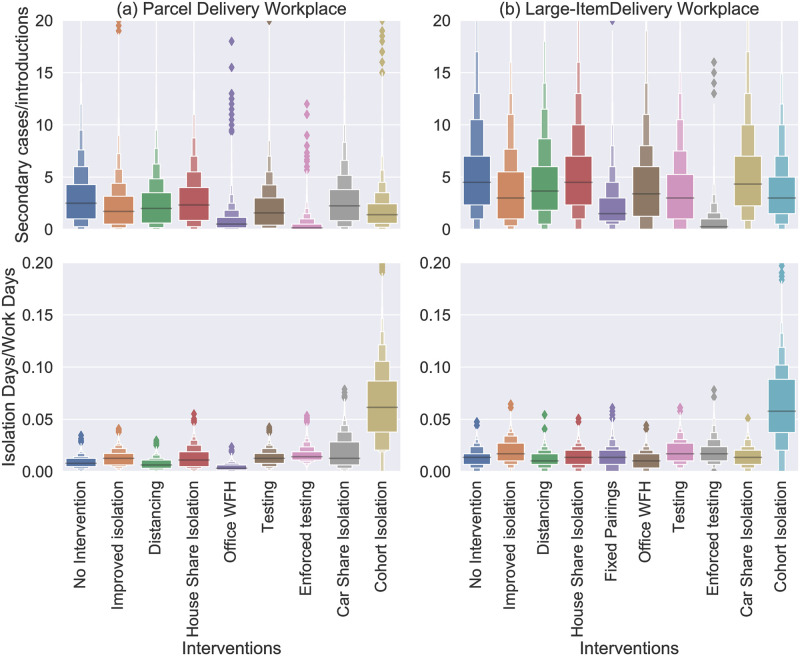
Fig 8.
Boxen plots [38] of the rates of onward transmission (number of secondary cases divided by the number of introductions, top) and rates of isolation (number of isolation day divided by scheduled work days, bottom) over a 3 month period in (a) the SPDD work setting and (b) the LIDD work setting. Each distribution shows all the simulations (from 10000) with more than one introduction. Each distribution represents the case with application of a single intervention, as labelled on the x-axis.

