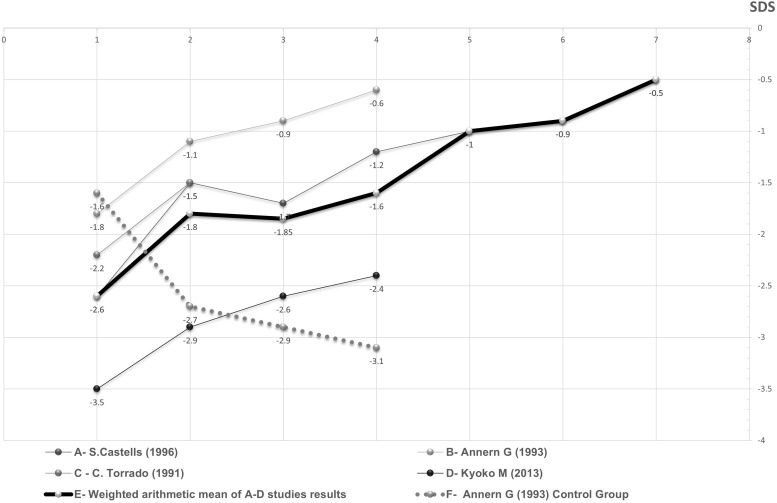
Figure 2.
Periodic average height SDS of DS patients during GH treatment as a function of duration of treatment in years. The fragmented and continuous lines represent different DS patients groups whose source data appear in the studies mentioned in the figure itself. The thickened line represents the weighted arithmetic mean of GH treated groups. The dotted line represents the control group.

