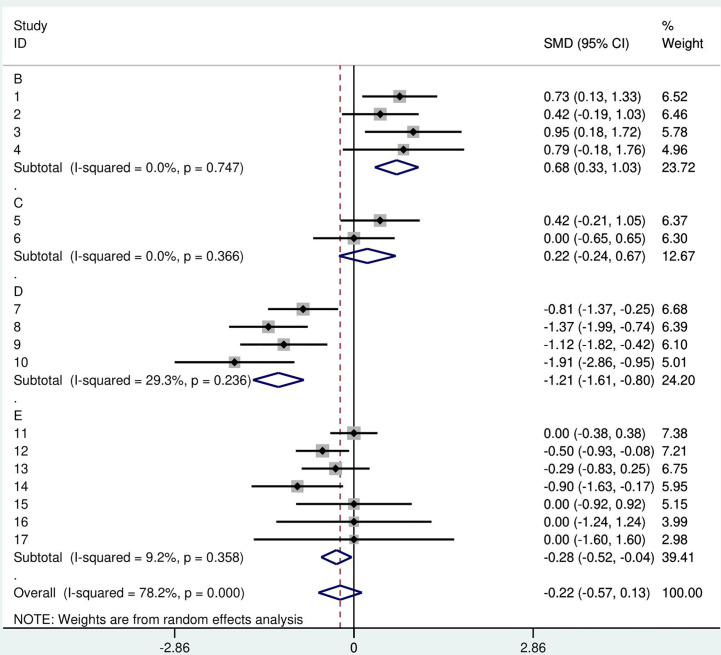
Figure 3.
A forest plot of the GH therapy mini meta-analysis by study. Random effects meta-analysis of height SDS was performed in comparison to the reference group. Squares- point represent the result of each study, each year of GH treatment, or follow-up. A- Castells S. 1996. B- Annerén G.1993. C- Torrado C. 1991. D- Meguri K 2013. E- weighted arithmetic mean of GH treated groups, F- Annerén G. 1993 control group.

