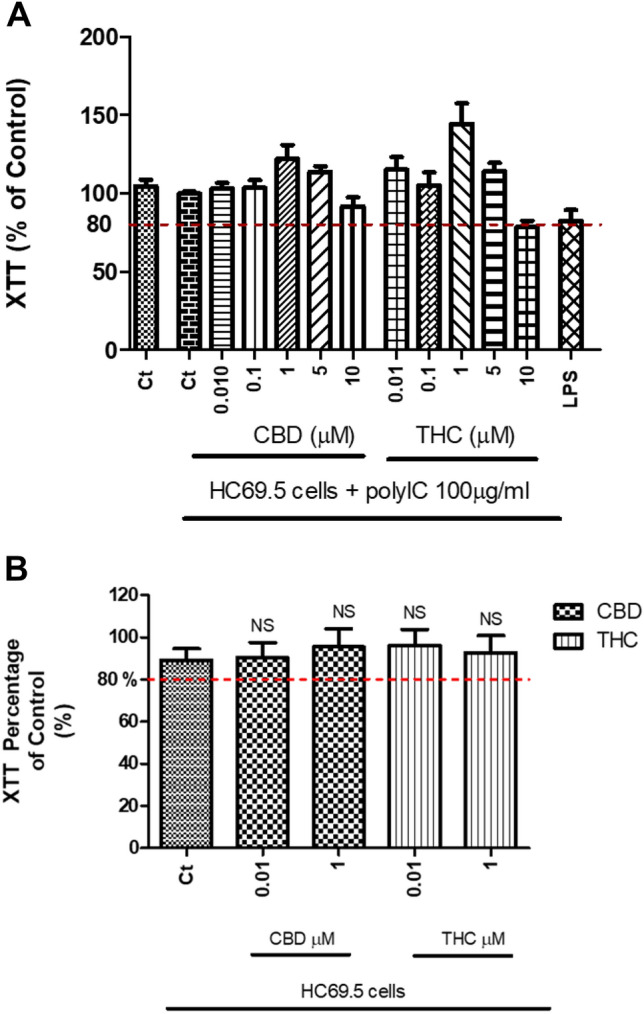
Figure 1.

(A) HC69.5 cells were treated with 100 µg/ml of poly IC and different concentrations of CBD or THC. After 24 h of drug treatment, the XTT-activated reagent was added. Cells treated with LPS were used as positive control. (B) Similarly, cells without poly IC were treated with different concentrations of CBD or THC. After 24 h of drug treatments, the XTT-activated reagent was added, and absorbance was measured after 4 h. Results are presented as a percentage of control, untreated HC69.5 cells. GraphPad Prism 5 software was used to plot and conduct statistical analysis. Normality distribution was checked by Kolmogorov–Smirnov test, while ANOVA and Dunns calculated statistical significance as a post-hoc test. Experiments were performed at least three times in replicates.
