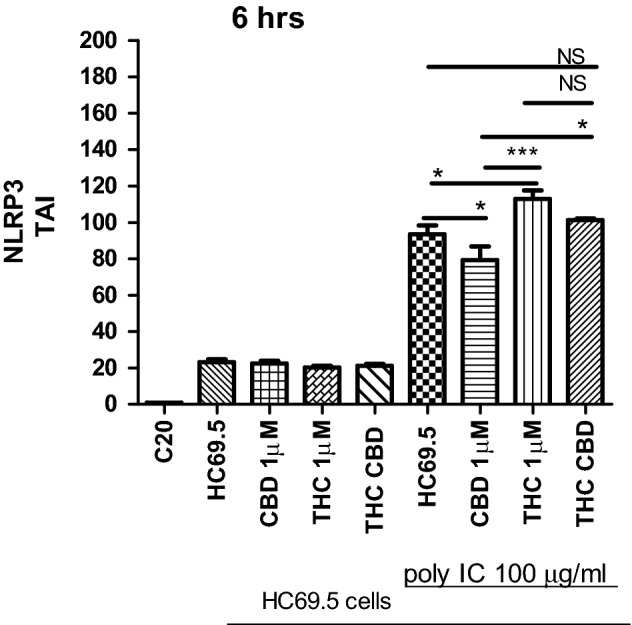
Figure 6.

NLRP3 gene expression on HC69.5. HIV (GFP+) cells was assessed by RT PCR. H69.5 cells treated with/without 100 μg/ml Poly IC, 1 μM concentration of CBD or/and Δ (9)-THC. After 6 h of treatments, RNAs were extracted, and reverse transcribed followed by real time PCR for NLRP3 gene (Hs00918082_m1; Thermofisher Scientific). GAPDH (Hs99999905_m1) was used as a housekeeping gene. Data represent the means ± standard error of three independent experiments. Graph represents the transcript accumulation index respect to negative control C20. Data were analyzed using GraphPad Prism software. The normality distribution was evaluated by Kolmogorov–Smirnov test, while statistical significance was calculated by ANOVA and Tukey Multiple Comparison Test as a post hoc test. Differences were considered significant at p ≤ 0.05.
