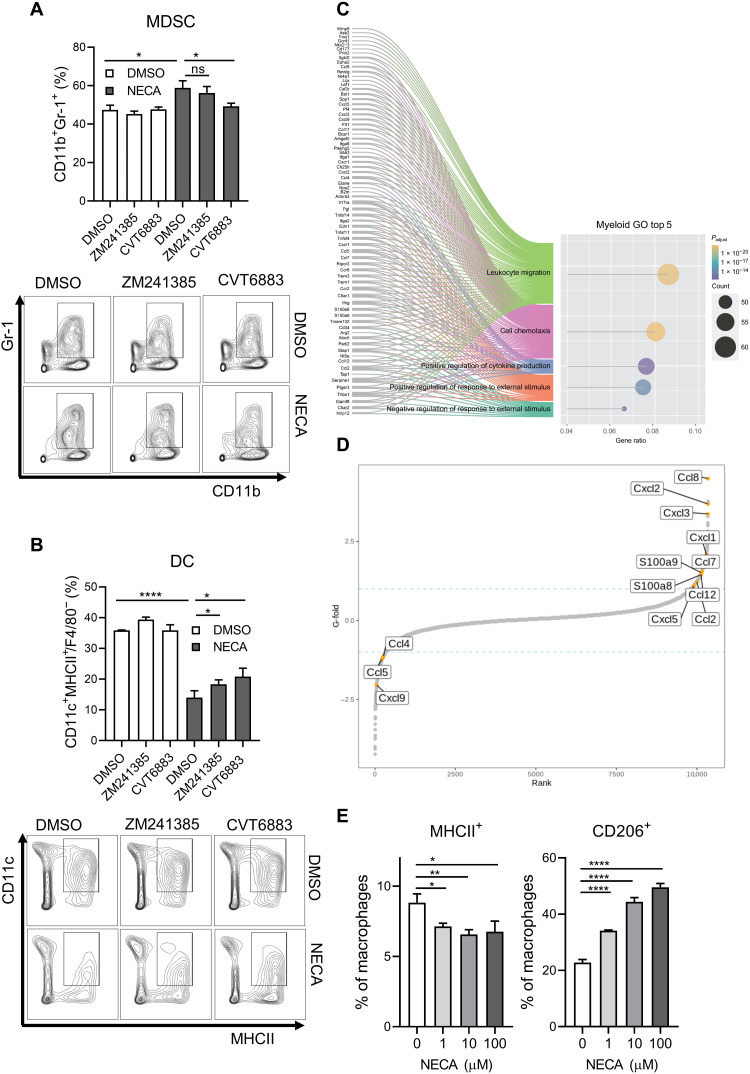
Fig. 4. Adenosine skews myeloid cells to immunosuppressive phenotypes.
(A and B) Bone marrow progenitor cells were cultured with 10 μM NECA in the presence of vehicle (DMSO), 100 nM A2AR antagonist (ZM241385), or 100 nM A2BR antagonist (CVT6883) for 5 days with IL-4 and GM-CSF. The percentages of (A) MDSC and (B) DC were determined by flow cytometry. (C and D) Bulk RNA sequencing was performed on NECA-treated bone marrow progenitor cells. (C) GO term enrichment analysis revealed the top five GO terms most enriched in NECA-treated bone marrow cells as compared to vehicle control. (D) Dot plot showed the fold change of a panel of chemokines as compared to vehicle. (E) Percentages of (left) MHCII+ and (right) CD206+ bone marrow–derived macrophages treated with indicated doses of NECA for 2 days with M-CSF. Error bars indicate means ± SD. *P < 0.05, **P < 0.01, and ****P < 0.0001 versus 0 μM or DMSO as indicated. Student’s t test.

