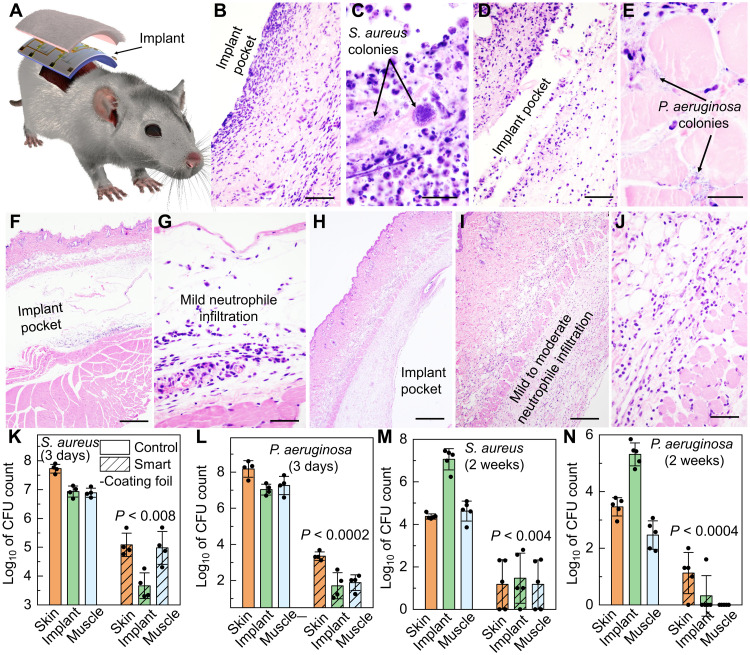
Fig. 5. In vivo authentication of antimicrobial performance of the smart-coating foils.
(A) Schematic showing the mouse subcutaneous implantation model. (B to E) Images of the hematoxylin and eosin (H&E)–stained histologic sections showing the tissues surrounding the planar foils subject to S. aureus (B) or P. aeruginosa (D) challenges (scale bars, 50 μm), with the magnified views [(C) for S. aureus and (E) for P. aeruginosa; scale bars, 20 μm) highlighting the formation of microcolonies. (F to J) Tissues surrounding the smart-coating foils challenged with S. aureus under low [(F) scale bar, 500 μm] and high [(G) scale bar, 50 μm] magnifications or P. aeruginosa under low [(H) scale bar, 500 μm], medium [(I) scale bar, 200 μm], and high [(J) scale bar, 50 μm] magnifications, showing only mild neutrophilic inflammation and tissue damage but no evidence of intralesional bacterial colonies. (K to N) Comparisons of the S. aureus (K) and (M) and P. aeruginosa (L) and (N) burdens on the implanted planar controls (green, solid bars), the smart-coating foils (diagonal hatched bars), and their surrounding skin (orange) and muscle (blue) tissues after 3 days [(K) and (L) N = 4] and 2 weeks [(M) and (N) N = 5] in vivo, respectively. P values for unpaired t test with unequal variance between planar controls and smart-coating foils as well as their associated surrounding tissues are all less than 0.008.

