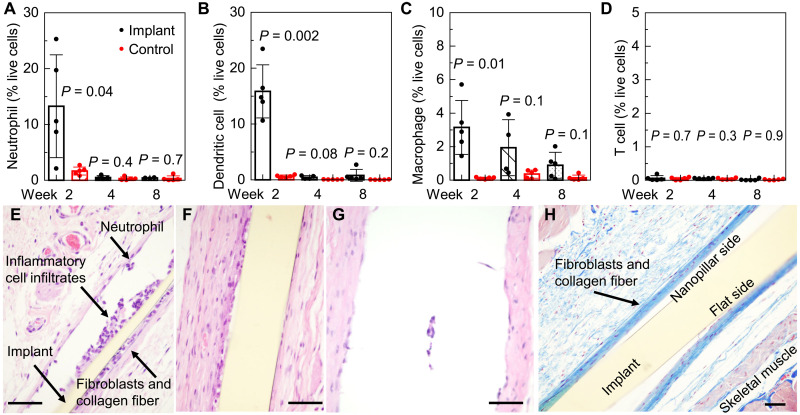
Fig. 6. In vivo authentication of biocompatibility of the smart-coating foils.
(A to D) Time evolution of the abundance of neutrophils (A), dendritic cells (B), macrophages (C), and T cells (D) in the tissues surrounding the implanted smart-coating foils (black), with the tissues collected from mice without receiving the surgery as control (red). N = 5. P values are determined from unpaired t test with unequal variance between controls and implants. (E to G) Histopathology of H&E-stained tissues surrounding the smart-coating foils 2 weeks (E), 4 weeks (F), and 8 weeks (G) (note that the foil was retrieved beforehand for the antimicrobial assays displayed in Fig. 7, D and E) after implantation. (H) Masson’s trichrome staining demonstrated a mild degree of peri-implant fibrosis, as evidenced by a thin layer of blue-stained collagen fibers surrounding the smart-coating foil 8 weeks after implantation. Scale bars, 50 μm.

