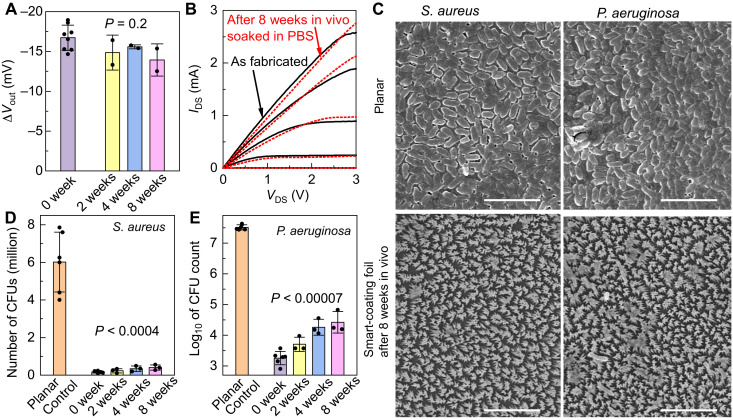
Fig. 7. Authentication of long-term stability of the smart-coating foils in vivo.
(A) ∆Vout of the silicon-nanomembrane Wheatstone bridge gauges subject to tensile strain of 0.1%, before (purple) and after 2 weeks (yellow), 4 weeks (blue), and 8 weeks (pink) in vivo. P value determined by one-way analysis of variance (ANOVA) is 0.2. (B) Current-voltage characteristics of the selector transistors before (black solid lines) and after 8 weeks in vivo (red dashed lines), measured with the whole device submerged in PBS. VDS, source-drain bias; IDS, source-drain current. (C) SEM micrographs showing the in vitro bacterial biofilm formation on the control planar films (top frames) and the mechano-bactericidal smart-coating foils retrieved after 8 weeks in vivo (bottom frames). Films were incubated with 105 to 106 CFUs of S. aureus (left frames) or P. aeruginosa (right frames) for 48 hours in a nutrient-rich medium. Scale bar, 5 μm. (D and E) The number of CFUs of S. aureus (D) or P. aeruginosa (E) after in vitro incubation with the planar controls (orange) or the smart-coating foils that were freshly prepared (0 weeks; purple) or those that were retrieved after subcutaneous implantation in mice for different periods of time, showing their quantitatively similar bactericidal efficacy. N ≥ 3. P values for unpaired t test with unequal variance between planar controls and smart-coating foils are all less than 0.0004.

