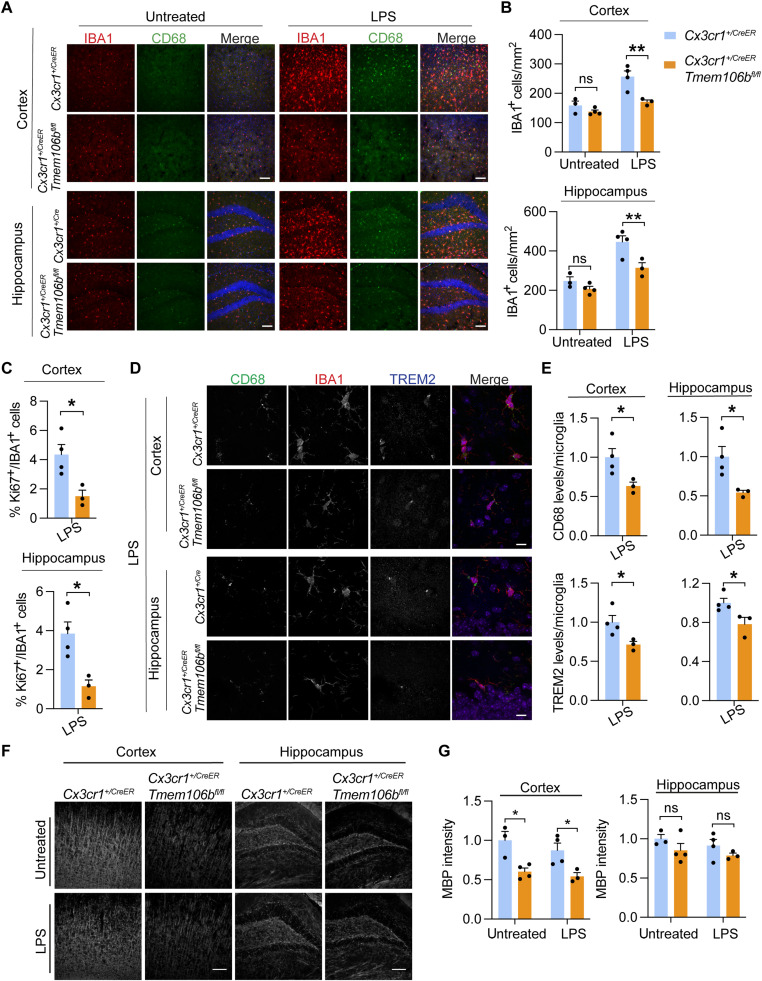
Fig. 7. Microglia-specific ablation of TMEM106B results in decreased microglial proliferation and activation in response to LPS.
(A to C) Cx3cr1+/CreER Tmem106b flox/flox mice and Cx3cr1+/CreER mice were fed with tamoxifen for 2 weeks at 4 weeks of age and untreated or treated with LPS intracerebroventricularly at 12 weeks of age. Brains were harvested 72 hours after injection, and brain sections were stained with IBA1 and CD68 antibodies. Representative images from the cortex and dentate gyrus of the hippocampus were shown (A). Scale bars, 100 μm. The number of IBA1+ microglia was quantified (B). Data represent the means ± SEM. Statistical significance was analyzed using two-way ANOVA (n = 3 to 4 mice per group). (C) Brain sections from experiments described in (A) were stained with Ki67 and IBA1 antibodies, and the percentage of Ki67+IBA1+ microglia in the cortex and hippocampus region after LPS treatment was quantified. Data represent the means ± SEM; unpaired two-tailed Student’s t test (n = 3 to 4 mice per group). (D and E) Brain sections from LPS-treated control and 106bfl/fl mice were stained with CD68, TREM2, and IBA1 antibodies. Representative images from the cortex and dentate gyrus of the hippocampus were shown (D). Scale bars, 10 μm. The levels of CD68 and TREM2 per microglia were quantified (E). Data represent the means ± SEM; unpaired two-tailed Student’s t test (n = 3 mice per group). (F and G) Brain sections from untreated or LPS-treated control and 106bfl/fl mice were stained with MBP antibodies. Representative images from the cortex and dentate gyrus of the hippocampus were shown (F). Scale bars, 100 μm. MBP intensities were quantified in (G). Data represent the means ± SEM; two-way ANOVA (n = 3 to 4 mice per group). *P < 0.05 and **P < 0.01.

