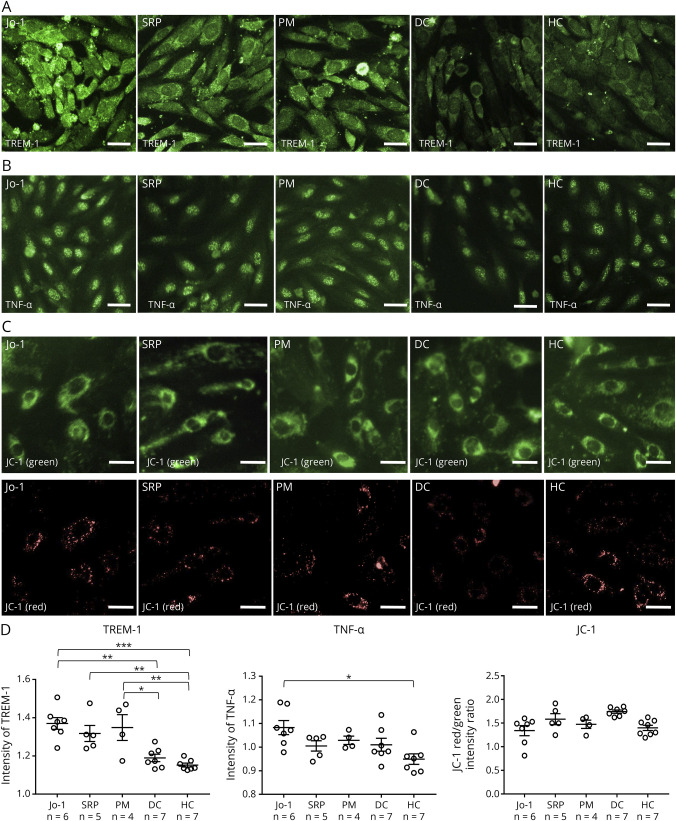
Figure 3. Changes of TREM-1 and TNF-α in TSM15 Cells After Exposure to IgGs From Patients With Jo-1, SRP, or PM.
(A, B) Immunostaining of TSM15 cells for TREM-1 and TNF-α (green) after exposure to IgGs (500 µg/mL) from patients with Jo-1, patients with SRP, patients with PM, DCs, or HCs. (C) Immunostaining of TSM15 cells for JC-1 (green/red) after exposure to IgGs (500 µg/mL) from patients with Jo-1, patients with SRP, patients with PM, DCs, or HCs. The JC-1 red/green intensity ratio reflects the mitochondrial potential. Images were captured by an IN Cell Analyzer 2000. Scale bar, 20 μm. (D) Scatter plots of the intensity of TREM-1, TNF-α, or the JC-1 red/green intensity ratio, as determined by high-content imaging after exposure to IgGs from patients with Jo-1 (n = 7), patients with SRP (n = 5), patients with PM (n = 4), DCs (n = 7), and HCs (n = 7). The data were normalized to cultures that had not been exposed to human IgG and were obtained from 3 independent experiments. p Values were determined by a one-way ANOVA, followed by the Tukey multiple comparison test (*p < 0.05, **p < 0.01, ***p < 0.001 vs the DC or HC group). ANOVA = analysis of variance; DCs = disease controls; DM = dermatomyositis; HCs = healthy controls; PM = polymyositis; SRP = signal recognition particle.

