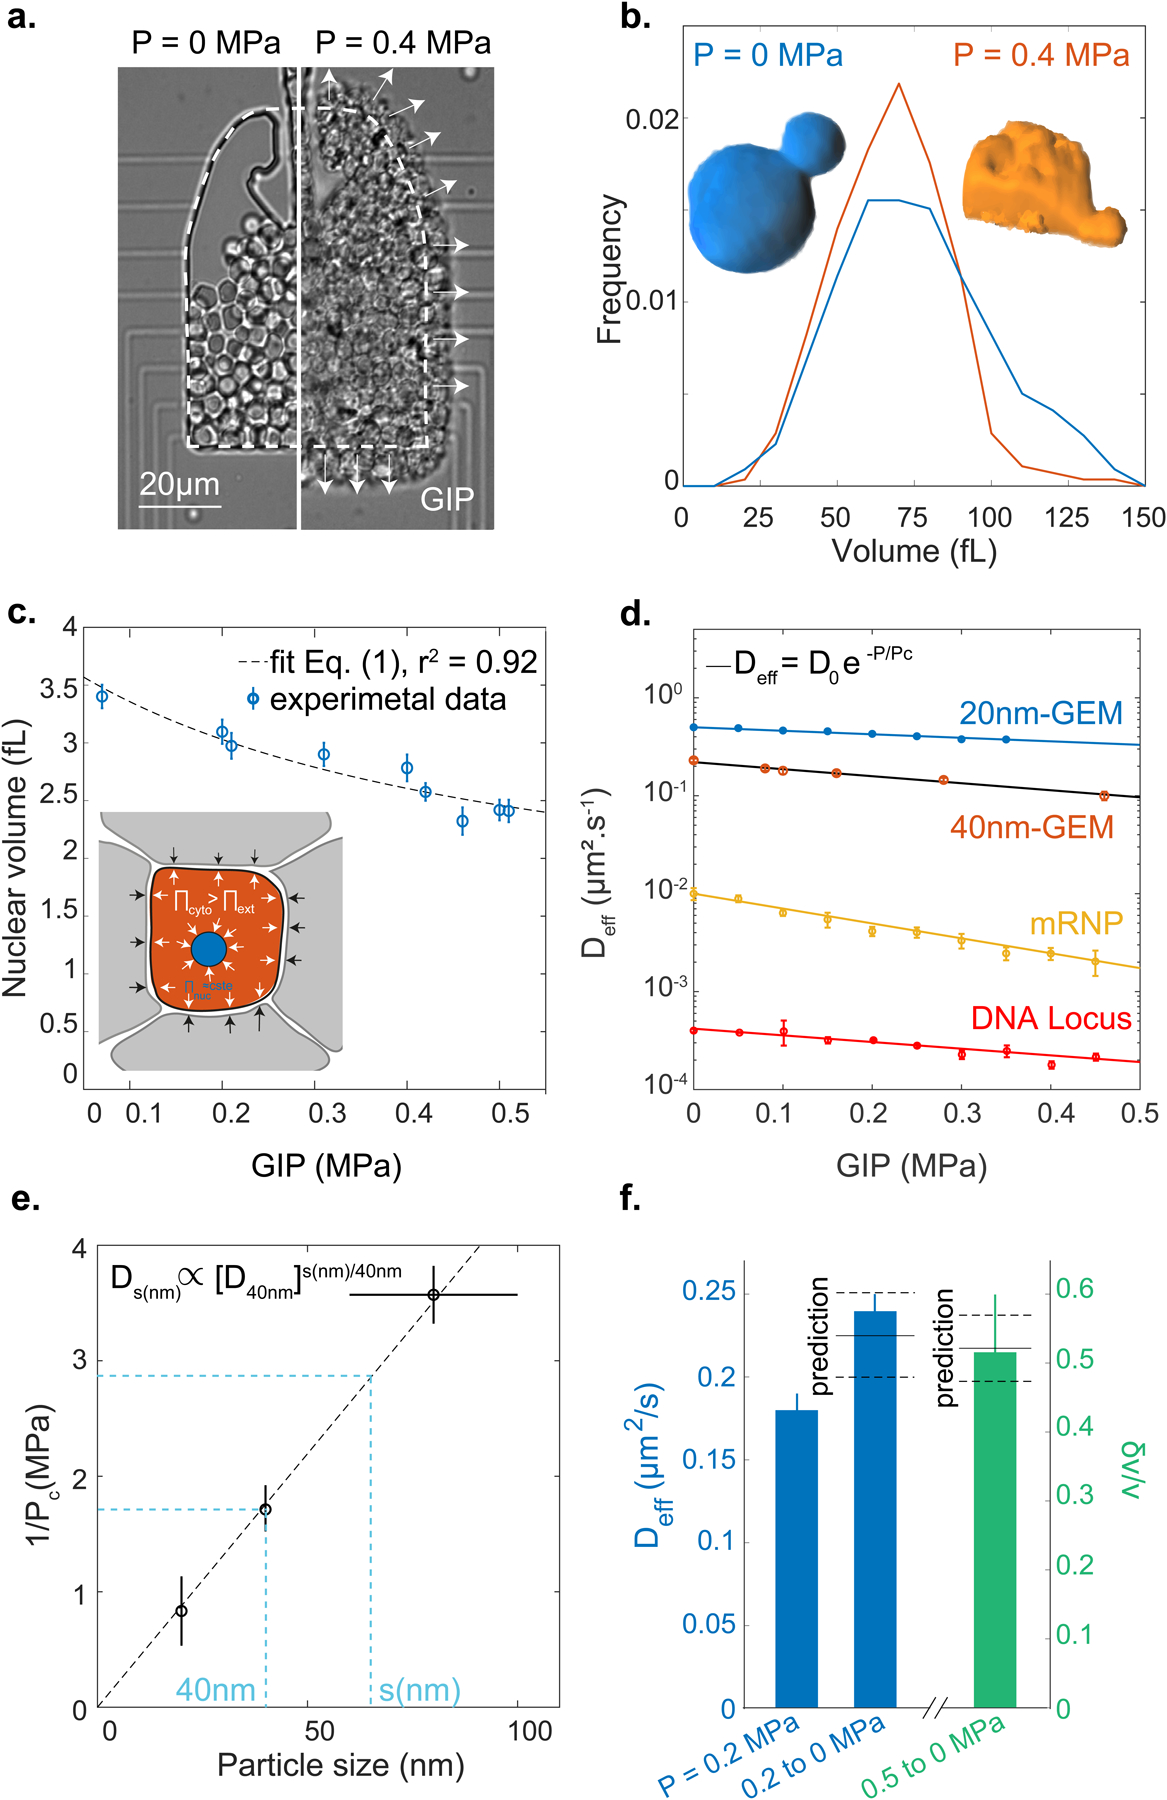
Figure 1. Confined growth leads to the intracellular accumulation of osmolytes and macromolecules.

a. Confined growth leads to the build-up of growth-induced pressure (GIP), measured by the deformation of the PDMS chamber. b. Cell volume distribution under GIP. Insets: representative 3D reconstructions of a non-compressed cell and a cell at 0.4 MPa. Both cells have a similar volume ~65 fL. c. Nuclear volume decreases under GIP. Dashed line: fit of nuclear volume as a function of GIP assuming constant nuclear osmotic pressure Eq. (1) (r2 = 0.92). d. Diffusivities of various particles and a DNA locus all decrease exponentially as a function of GIP. Solid black curve is the model prediction for 40nm-GEMs r2 = 0.98. e. The characteristic pressure (Pc) of the exponential dependence is inversely proportional to cytosolic particle size. f. After sudden pressure relaxation, effective diffusion rises quickly (< 1 minute) to control (uncompressed) values and cell volume increases (δv) due to stored osmotic pressure. Predicted values are indicated. The diffusion data fall within 7% of the prediction, while the volume data fall within 2%. In all data, values are mean ± standard error of the mean, N ≥ 3 independent biological replicates.
