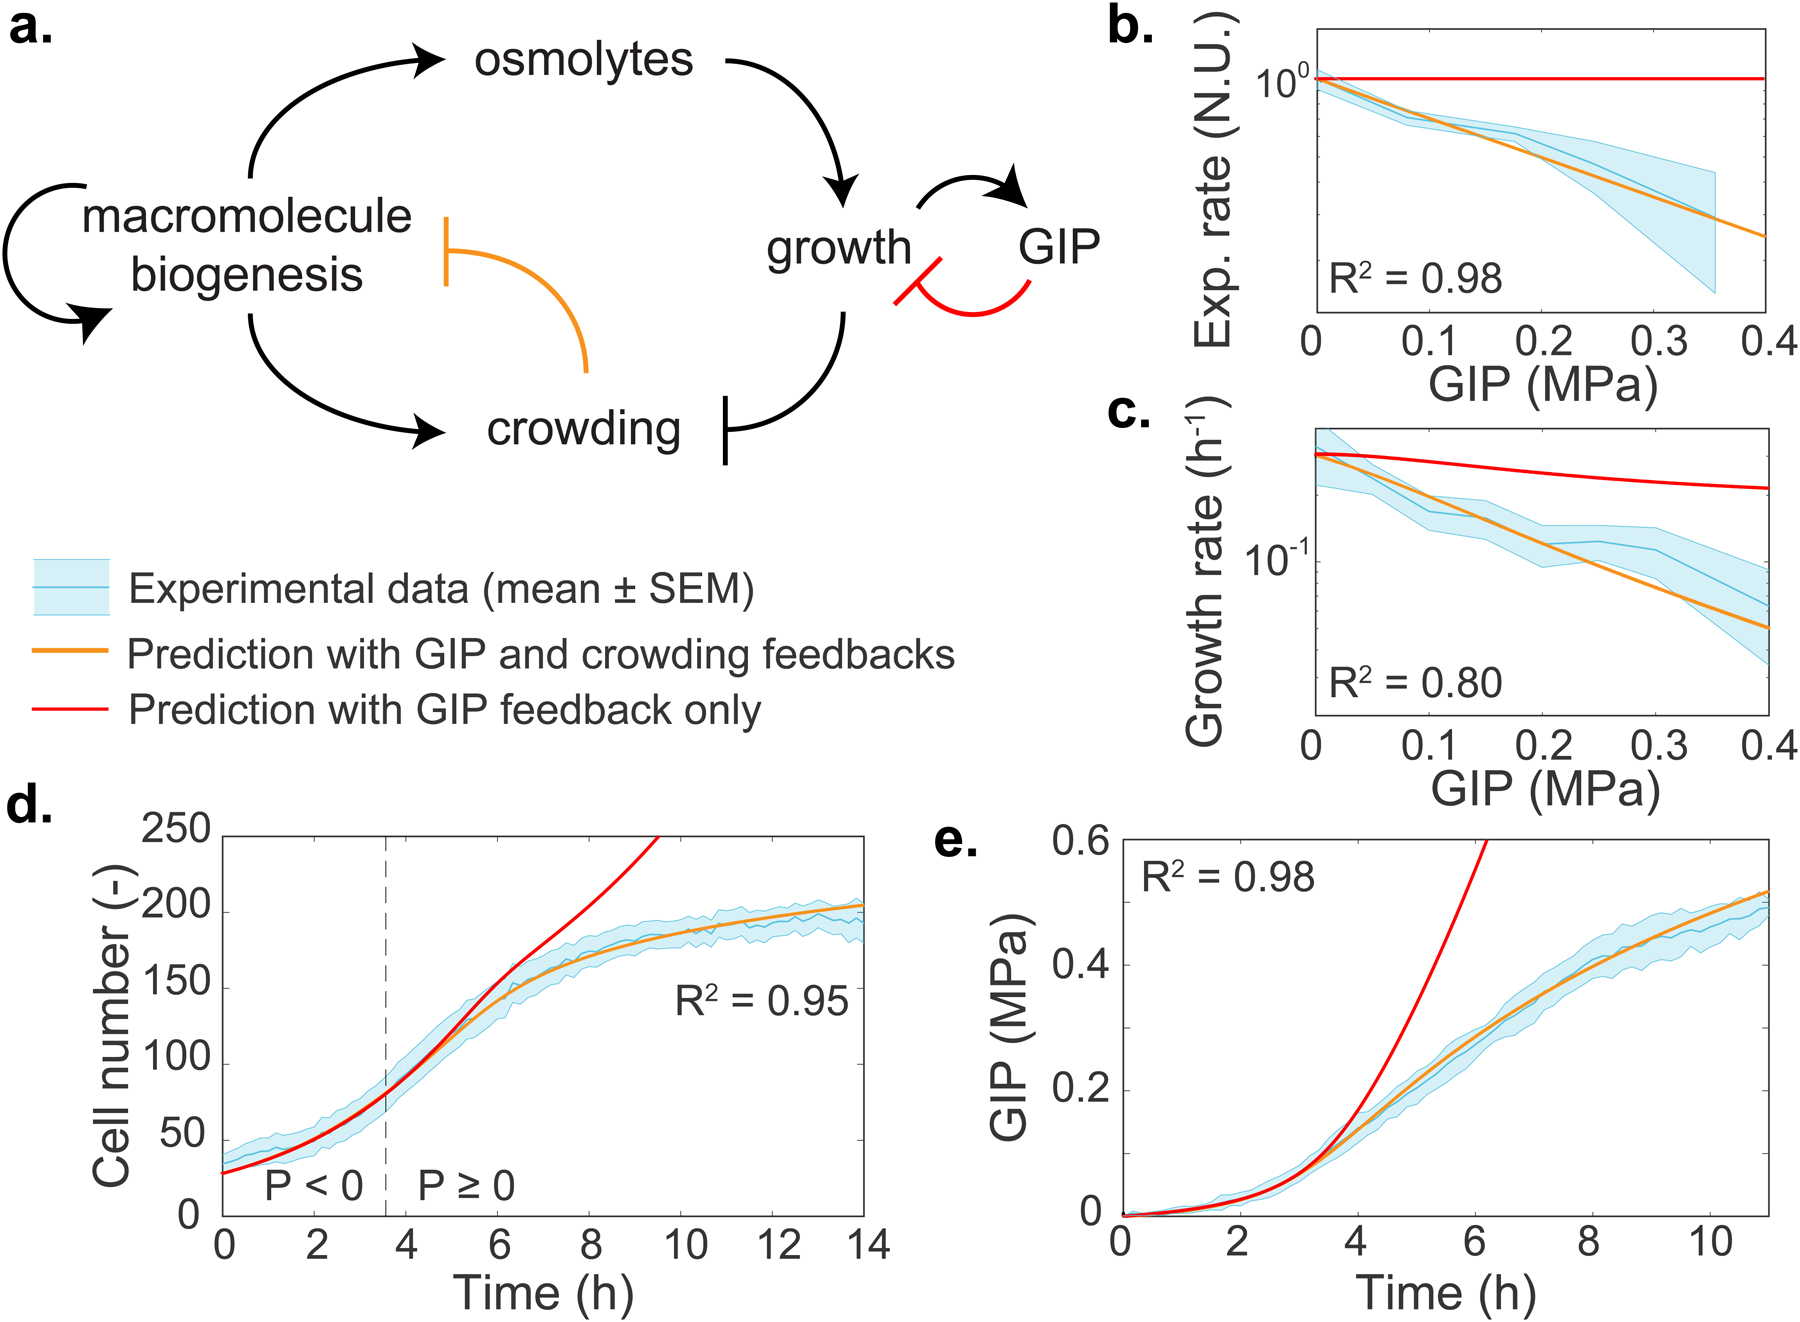
Figure 4. A physical feedback model, in which crowding limits protein production, predicts the dynamics of confined cell growth.

a. Schematic of the model. After confluence is reached, growth induced pressure (GIP) increases as a function of cell volume change and the effective elasticity of the surrounding cells and PDMS chamber walls. Cells must accumulate more osmolytes to grow in the face of increasing effective elasticity, therefore volume expansion is inhibited. Macromolecule biogenesis is proportionally coupled to osmolyte production and so intracellular crowding increases. Increased mesoscale crowding feeds back onto many processes including the processes associated with macromolecule biogenesis itself, thereby limiting growth. b-e. Predictions of the dependence of various observables on GIP from the model. All parameters are experimentally determined. Predictions are shown for: effective protein expression rate (kexp, b); growth rate (c); cell number (d); and GIP (e). In all plots, the thick orange line represents the model prediction. The thick red line represents the prediction of the model without any physical (crowding) feedback on biomass production. The dashed line represents the onset of confluence and GIP buildup. The R2 value indicates the square difference of the model against the data. Values are mean ± standard error of the mean; N ≥ 3 independent biological replicates.
