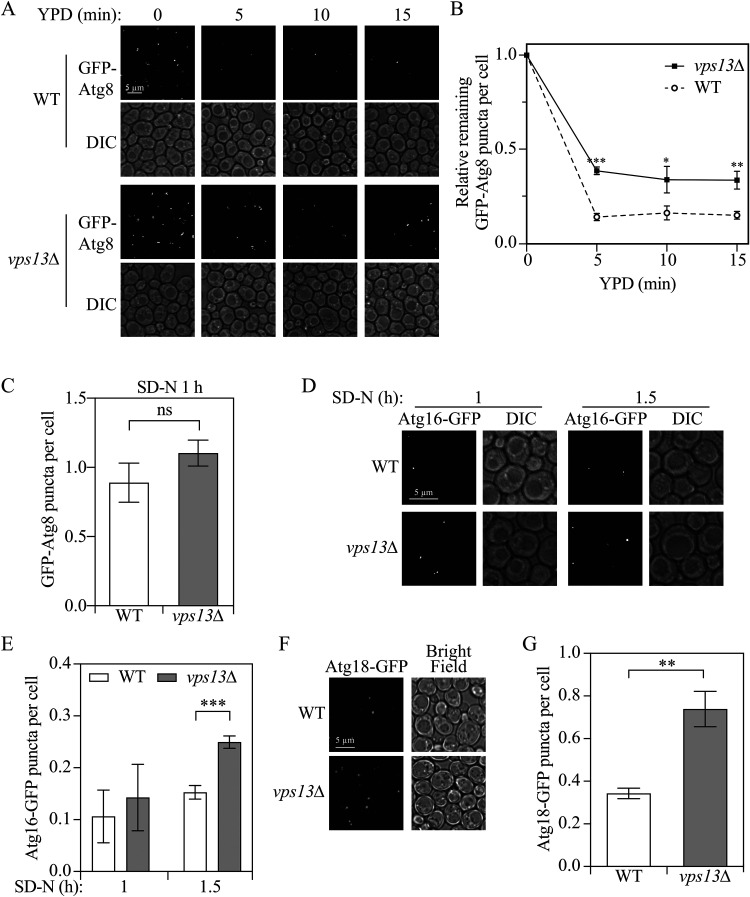
Figure 2.
Vps13 functions in a late stage of autophagy. (A and B) Wild-type (YLY085) and vps13Δ (YLY086) strains were grown in YPD to mid-log phase and shifted to nitrogen-starvation medium. After starvation for 1 h (YPD 0 min), cells were shifted back to YPD and samples were collected after 5, 10 and 15 min and imaged. Total puncta number to total cell number ratio was quantified at every time point and the ratio was normalized to the samples at 0 min, which was set to 1.0. (C) Quantification of the total GFP-Atg8 puncta to total cell number ratio after 1-h starvation as described in (A). (D and E) Wild-type (UNY174, Atg16-GFP) and vps13Δ (YLY144, Atg16-GFP) cell samples were collected at 1 and 1.5 h after nitrogen starvation (SD-N) and imaged. Total puncta to total cell number ratio was quantified at every time point. (F and G) Wild-type (YLY394, Atg18-GFP) and vps13Δ (YLY395, Atg18-GFP) cell samples were collected 1.5 h after nitrogen starvation and imaged. The total puncta to total cell number ratio was quantified. In the quantitative analyses, the error bar represents the SD of three independent experiments. Two-tailed t test was used for statistical significance. *p < 0.05, **p < 0.01, ***p < 0.001; ns, not significant. DIC: differential interference contrast.

