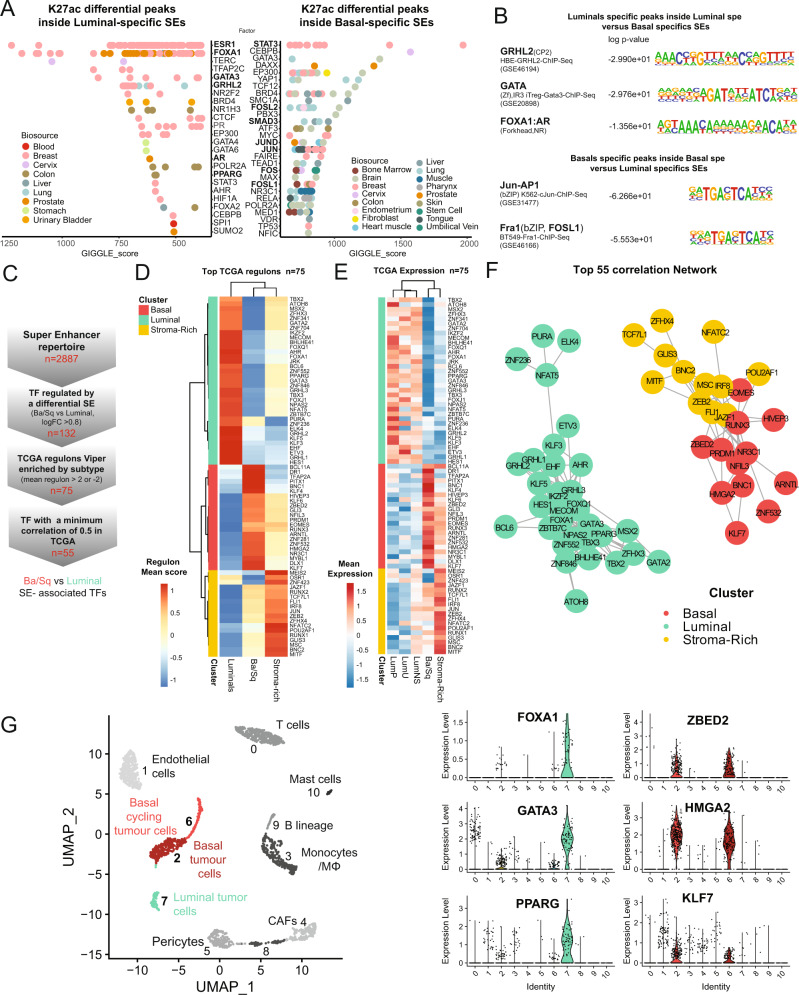
Fig. 4. Super-enhancers regulate a network of candidate master transcription factors for bladder cancer subgroups.
A Cistrome analysis of LumP and Ba/Sq specific enhancers. B Homer motif enrichment analysis in H3K27ac differential peaks inside differential SE in Luminal vs Basal and Basal vs Luminal. C Methodology to identify key coregulated SE-associated TFs. D Heatmap of the top 75 TFs with high regulon score. Clustering identified 3 major clusters. E Heatmap of the top 75 TFs expression in TCGA-BLCA. F Correlation network of the top 55 TFs with an expression correlation coefficient of min 0.5 in TCGA-BLCA cohort. G Single-cell RNA-seq analysis of one bladder cancer tumour with both basal and luminal population (GSM4307111 [36]) Right panel, associated expression for key TFs in each compartment.

