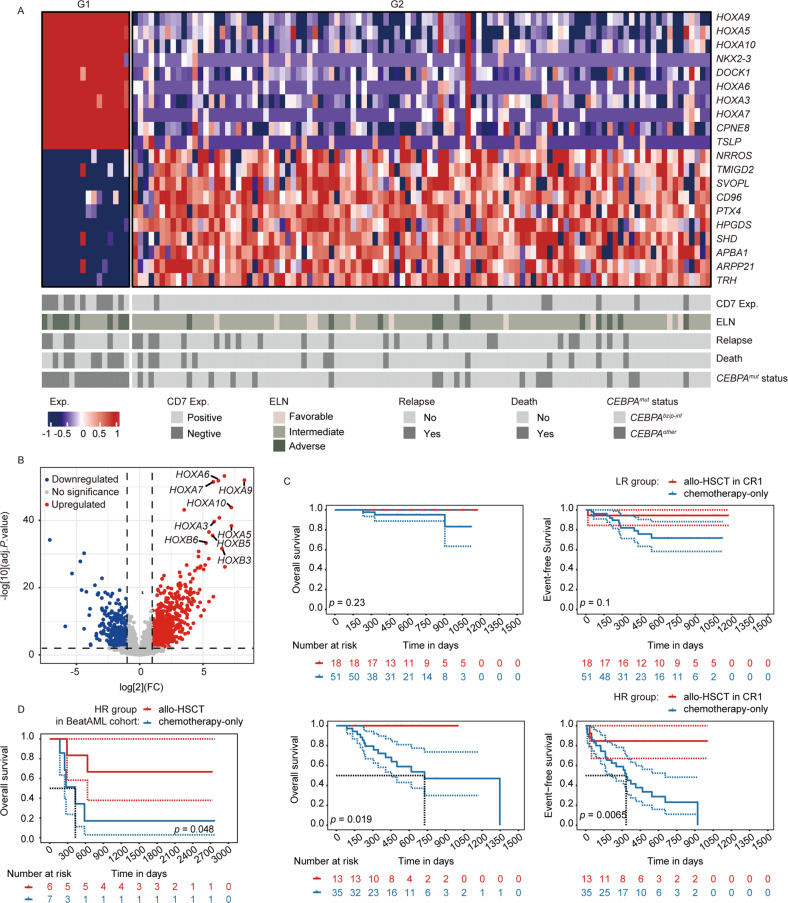
Fig. 2. Differentially expressed genes and survival analysis of two distinct sub-cohorts of patients with CEBPAmut AML.
A Top ten DEGs identified as up- (red) or down- (blue) regulated were ranked by the the magnitude of expression value change. B Volcano plot showing DEGs according to the two distinct sub-cohorts clustered by unsupervised hierarchy. C Kaplan–Meier curves for the survival of LR (upper panel) and HR (lower panel) CEBPAmut AML patients according to treatment of allo-HSCT in CR1 or chemotherapy-only. D Kaplan–Meier curves for the OS of HR CEBPAmut AML patients within the BeatAML cohort according to treatment of allo-HSCT or chemotherapy-only.

